All official European Union website addresses are in the europa.eu domain.
See all EU institutions and bodiesAn official website of the European Union | How do you know?
Environmental information systems
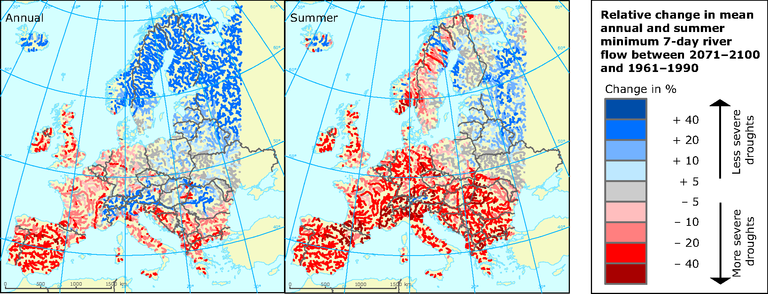
Projected change in mean annual and summer minimum 7-day river flow between 2071-2100 and the reference period 1961-1990
Map (static)
Red indicates more severe droughts, blue less severe droughts

Downloads
Data sources
Metadata
More info
Loading
- Albania
- Andorra
- Armenia
- Austria
- Belarus
- Belgium
- Bosnia and Herzegovina
- Bulgaria
- Croatia
- Cyprus
- Czechia
- Denmark
- Estonia
- Europe
- Finland
- France
- Germany
- Greece
- Hungary
- Iceland
- Ireland
- Italy
- Latvia
- Liechtenstein
- Lithuania
- Luxembourg
- North Macedonia
- Malta
- Monaco
- Montenegro
- Netherlands
- Norway
- Poland
- Portugal
- Romania
- Russia
- San Marino
- Serbia
- Slovakia
- Slovenia
- Spain
- Sweden
- Switzerland
- Ukraine
- United Kingdom
1961-1990
2071-2098
Simulations with LISFLOOD driven by HIRHAM HadAM3H/HadCM3 based on IPCC SRES scenario A2.
