All official European Union website addresses are in the europa.eu domain.
See all EU institutions and bodiesProgress towards selected waste management targets
Chart (static)
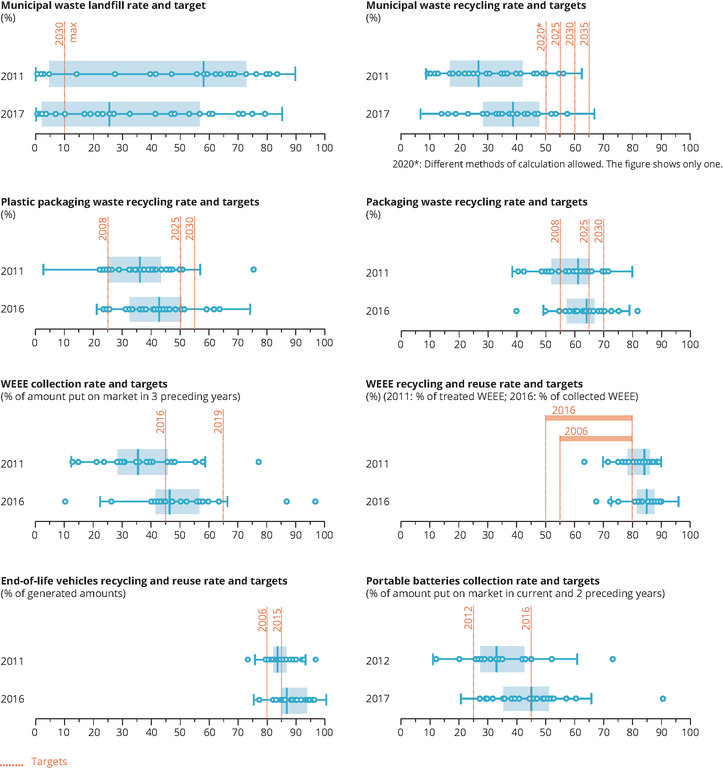
The figure shows the landfilling rate for municipal waste by country. Each dot represents a country. The boxes represent the upper and lower quartiles, and the line in the box shows the median.

- End-of-life vehicles - reuse, recycling and recovery, totals (env_waselvt)
- Sales and collection of portable batteries and accumulators (env_waspb)
- Waste Electrical and Electronic Equipment (WEEE)
- Municipal waste by waste management operations (env_wasmun)
- Austria
- Belgium
- Bulgaria
- Croatia
- Cyprus
- Czechia
- Denmark
- Estonia
- Finland
- France
- Germany
- Greece
- Hungary
- Iceland
- Ireland
- Italy
- Latvia
- Lithuania
- Luxembourg
- Malta
- Netherlands
- Norway
- Poland
- Portugal
- Romania
- Slovakia
- Slovenia
- Spain
- Sweden
- Switzerland
- United Kingdom
Methodology
Landfilling rate = (waste landfilled / waste generated) * 100
Recycling rate = (waste recycled / waste generated) * 100
Recycling rate = (waste recycled or reused / waste generated) * 100
Collection rate of WEEE: ( WEEE collected / average quantity of EEE put on the market in the previous three years) * 100
Recycling and reuse rate of total WEEE until 2013: (waste recycled and reused / waste treated) * 100
Recycling and reuse rate of total WEEE since 2014: (waste recycled and reused / waste collected) * 100
Collection of portable batteries and accumulators: (waste collected / the average weight placed on market in current and two preceding years) * 100
