All official European Union website addresses are in the europa.eu domain.
See all EU institutions and bodies
An official website of the European Union | How do you know?
Environmental information systems
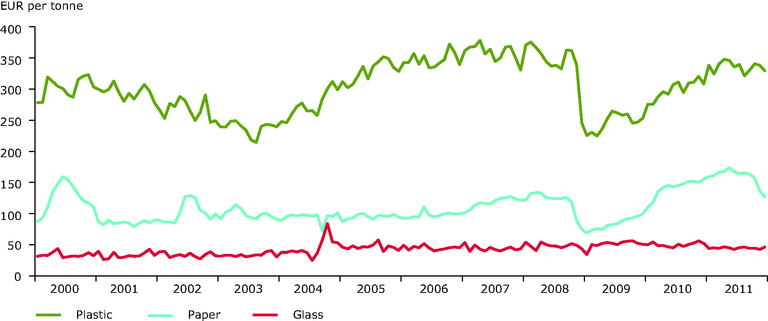
This figure shows the development in unit price on a monthly basis of plastic, paper and glass waste from January 2000 to December 2011. The prices are calculated as weighted averages of a number of sub waste fractions for export both within and out of the EU.
Loading