All official European Union website addresses are in the europa.eu domain.
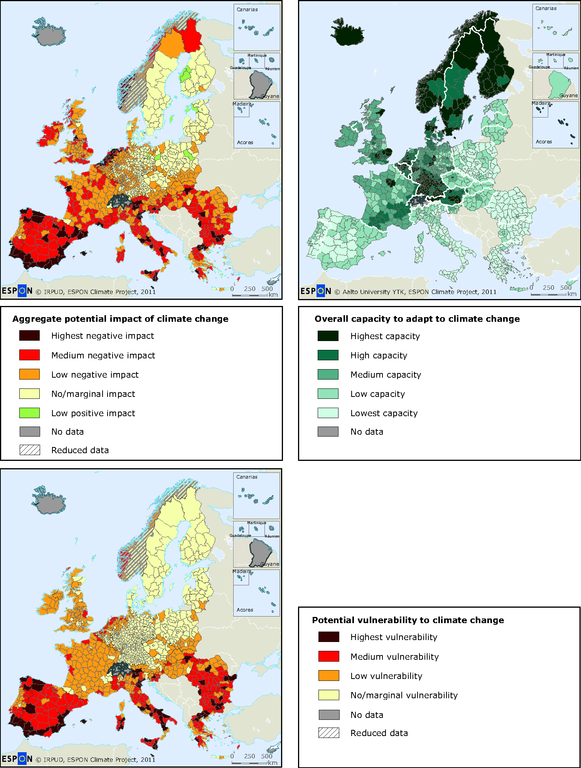
See all EU institutions and bodiesPotential aggregate impact, adaptive capacity and vulnerability
Map (static)
Overall impacts derived from 26 impact indicators, overall adaptive capacity from 15 individual indicators, and overall vulnerability from a combination of overall impacts and adaptive capacity.

- Climate Change and Territorial Effects on Regions and Local Economies
- Greece
- Poland
- Romania
- Portugal
- Spain
- United Kingdom
- Netherlands
- Belgium
- Germany
- France
- Czechia
- Italy
- Cyprus
- Estonia
- Latvia
- Lithuania
- Finland
- Hungary
- Bulgaria
- Malta
- Denmark
- Sweden
- Austria
- Luxembourg
- Ireland
- Slovakia
- Slovenia
Methodology
(Vulnerability) Combination of potential impacts and regional capacity to adapt to climate change. The potential impacts were calculated as a combination of regional exposure to climate change (difference between 1961-1990 and 2071-2100 climate projections of eight climatic variables of the CCLM model as well as inundation height changes according to the LISFLOOD river flooding model, both for the IPCC SRES A1B scenario, and projections of the DIVA model regarding coastal storm surge heights of a 100 year return event adjusted by one metre of sea level ise) and most recent data on the weighted dimensions of physical, economic, social, environmental and cultural sensitivity to climate change. Adaptive capacity was calculated as a weighted combination of most recent data on economic, infrastructural, technological and institutional capacity as well as knowledge and awareness of climate change.
(Aggregated) Weighted combination of physical (weight 0.19), environmental (0.31), social (0.16), economic (0.24) and cultural (0.1) potential impacts of climate change. Weights are based on a Delphi survey of the ESPON Monitoring Committee. Impacts calculated as combination of regional exposure to climatic changes and recent data on regional sensitivity. Climatic changes derived from comparison of 1961-1990 and 2071-2100 climate projections from CCLM model for the IPCC SRES A1B scenario. Regional coastal storm surge heights were calculated on the basis of a one metre sea level rise.
