All official European Union website addresses are in the europa.eu domain.
See all EU institutions and bodies
An official website of the European Union | How do you know?
Environmental information systems
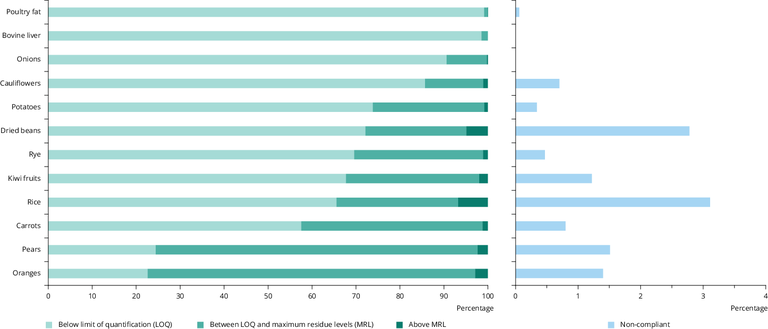
The diagram presents the percentage of samples from the most commonly-consumed food groups in Europe that were compliant with pesticide residues below or equal to the legal limit, higher than the legal limit or non-compliant.
Loading