All official European Union website addresses are in the europa.eu domain.
See all EU institutions and bodies
An official website of the European Union | How do you know?
Environmental information systems
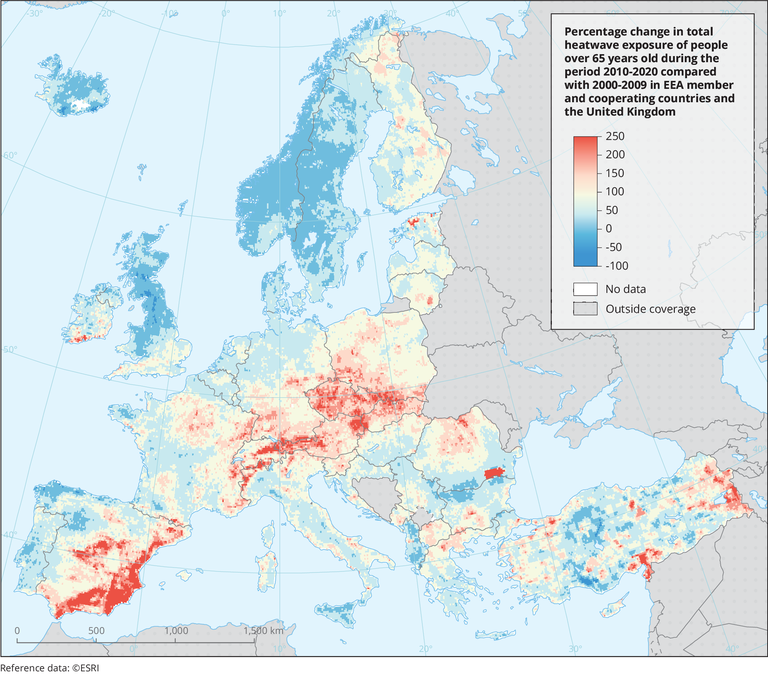
This map shows the percentage change in total heatwave exposure of people over 65 years old for the period 2010-2020 compared to 2000-2009 in EEA member and cooperating countries plus the United Kingdom. The indicator has been calculated by multiplying the number of people aged 65 years and older years by number of heatwaves. Heatwaves are defined as periods of 2 or more days on which both the minimum and maximum temperatures are above the local 95th percentile (defined according to 1986-2005 baseline).
Loading