All official European Union website addresses are in the europa.eu domain.
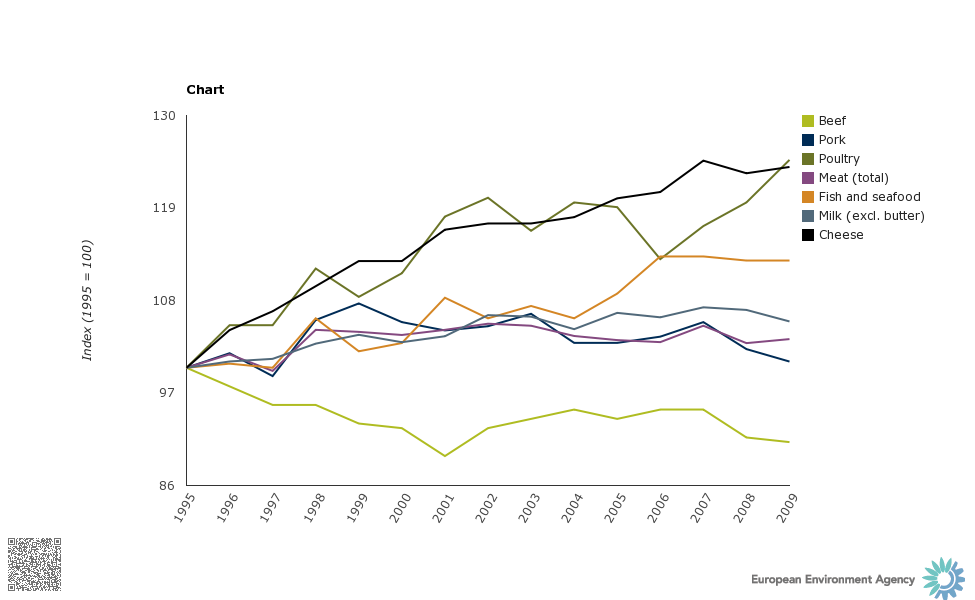
See all EU institutions and bodiesLine graph of changes over time in consumption per capita for poultry, cheese, fish and seafood, milk, meat, pork and beef (index: 1995 = 100)

