All official European Union website addresses are in the europa.eu domain.
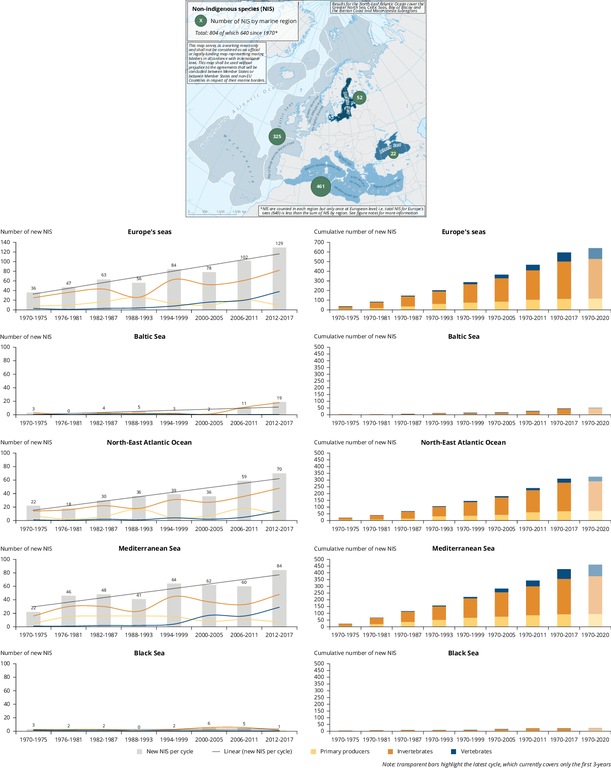
See all EU institutions and bodiesThe figure shows the number of new non-indigenous species (NIS) reported by marine region. The line-bar chart shows the total number of new introductions of NIS (grey bars) and by main species group (lines) reported in Europe’s seas combined and by marine region, per 6-year interval between 1970 and 2017. The stacked column charts show the cumulative number of new NIS introductions by main species group, in Europe’s seas combined and by marine region, per 6-year interval between 1970 and 2020.
Loading

