All official European Union website addresses are in the europa.eu domain.
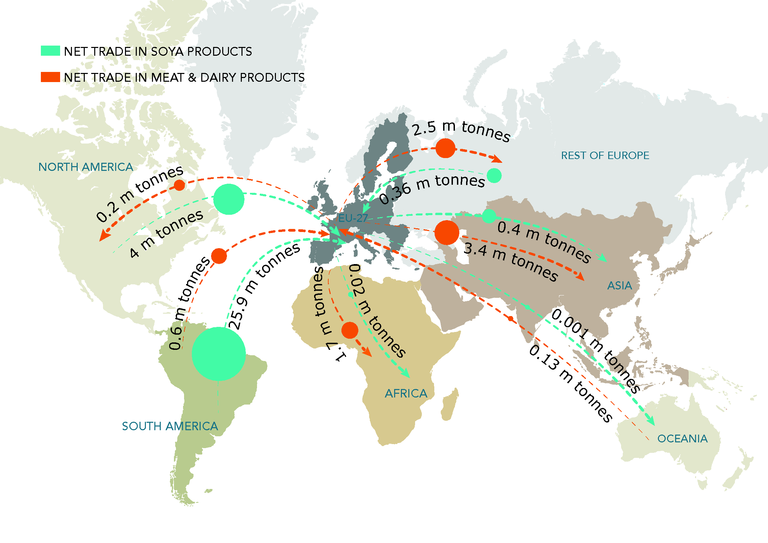
See all EU institutions and bodiesNet trade flows in soya, meat and dairy products between EU-27 and the rest of the world, 2012
Map (static)
The figure shows the net trade flows of soya and meat and dairy products between EU-27 and the rest of the world in 2012, showing the specific trade flows of these commodities between the different continents.

- EU27 trade since 1988 by CN8 (Eurostat)
- Austria
- Belgium
- Bulgaria
- Cyprus
- Czechia
- Denmark
- Estonia
- Finland
- France
- Germany
- Greece
- Hungary
- Ireland
- Italy
- Latvia
- Lithuania
- Luxembourg
- Malta
- Netherlands
- Poland
- Portugal
- Romania
- Slovakia
- Slovenia
- Spain
- Sweden
- United Kingdom
Methodology
Raw data from the comext database are extracted according to CN8 product code, trade partner, trade reporter, trade flow, unit of measurement and reference period. All data extracted for this graph refer to 2012 and EU-27 as reporter. All countries available in the database are selected as trade partners in order to have figures for the total imports and exports of EU-27 from and to the rest of the world. The countries are grouped geographically to form the regional trade partners of EU-27, namely, North America, South America, Africa, Asia, Oceania and the Rest of Europe (including other European countries outside EU-27 and Russia). Both import data and export data are extracted in order to calculate the net trade flow. CN8 product codes refering specifically to meat and dairy products are summed in order to produce the food product category 'Meat and dairy'. In the same way, product codes refering to soya products are summed in order to produce the food product category 'Soya'. In order to calculate the net trade quantities of 'meat and dairy' and 'soya' categories, the import data for each aggregated food product category of each regional trade partner is subtracted by the corresponding food product category of each regional trade partner. Negative net trade values indicate net export from EU-27 to the regional partner, while positive values indicate net import from the regional partner to EU-27.
For detailed information about the complete list of CN8 codes used in this graph, please refer to the Drill down data excel sheets.
