All official European Union website addresses are in the europa.eu domain.
See all EU institutions and bodies
An official website of the European Union | How do you know?
Environmental information systems
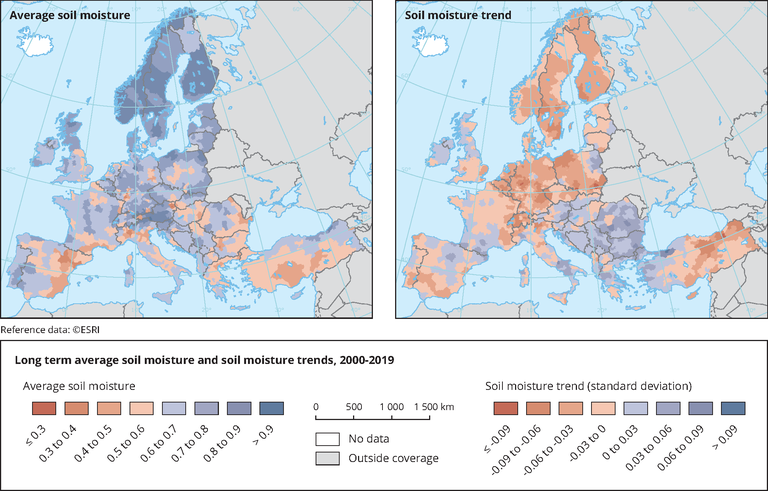
The maps show the long-term average soil moisture contents (left) and the trends in soil moisture values (right), aggregated by NUTS3 regions.
Soil moisture is equal to 0 when the soil is severely dry (wilting point) and equal to 1 when the soil moisture is above the field capacity. Low long-term average soil moisture values indicate areas where during the 2000-2019 period the soil moisture deficit was the biggest problem. Trends are expressed in standard deviation from the long term average. Negative trends indicate that soil moisture values show a decreasing tendency during the 2000-2019 period. Areas with lower soil moisture content together with decreasing tendency in the soil moisture are in risk of loosing their land functions of supplying ecosystem services.
See also:
https://www.eea.europa.eu/data-and-maps/data/data-viewers/soil-moisture and
Original dataset: https://edo.jrc.ec.europa.eu/documents/factsheets/factsheet_soilmoisture.pdf
Loading