All official European Union website addresses are in the europa.eu domain.
See all EU institutions and bodies
An official website of the European Union | How do you know?
Environmental information systems
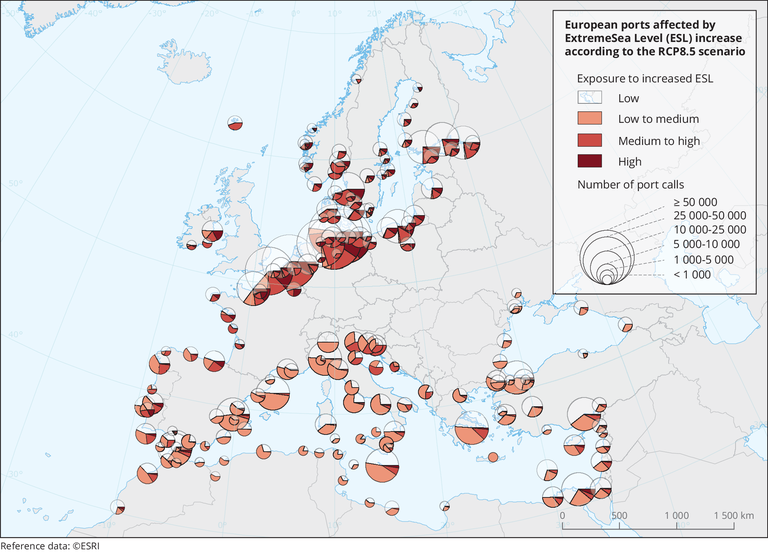
The map illustrates the secondary effects of the disruption of European port operations as a result of the projected increase of ESL until 2100. It is based on information on connections of container ports. The size of the pies represent the total number of connections or port calls and the coloured pieces of the pies represent the part of the total connections to ports exposed to different levels of ESL increases.
Loading