All official European Union website addresses are in the europa.eu domain.
See all EU institutions and bodies
An official website of the European Union | How do you know?
Environmental information systems
Left graph: Decline in ocean pH measured at the Aloha station (University of Hawaii) and yearly mean surface seawater pH reported on a global scale (Copernicus Marine Service); Right graph: Decadal average sea surface temperature anomaly in different Euro
Chart (static)
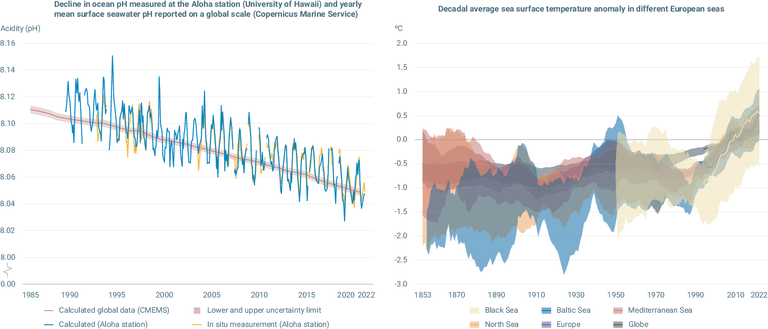
a) Decline in ocean pH measured at the Aloha station in the Pacific Ocean and yearly mean surface seawater pH reported on a global scale (Copernicus Marine Service; EEA, 2022a).
b) The past, present and future annual mean sea surface temperature for Europe’s seas. The black line shows the annual values for 1979-2018 from reanalysis data, and the dashed horizontal line shows the mean for 1986-2005 (for further details, see EEA, 2021a).
Downloads
Data sources
Metadata
More info
Loading
- ESA SST CCI: Level 4 Analysis Climate Data Record
- NOAA Extended Reconstructed Sea Surface Temperature (ERSST), Version 5
- HadSST.4.0.1.0
- HadISST
- Global Ocean acidification - mean sea water pH time series and trend from Multi-Observations Reprocessing
- Hawaii Ocean Time-series (HOT)
Methodology
Left graph:
https://hahana.soest.hawaii.edu/hot/hotco2/HOT_surface_CO2_readme.pdf
The OMI yearly mean surface sea water pH reported on total scale is computed from monthly pH values which are distributed as part of the CMEMS product MULTIOBS_GLO_BIO_REP_015_005. The estimated global mean surface sea water pH is based on alkalinity values (locally interpolated alkalinity regression) (LIAR), surface ocean partial pressure of CO2 (pCO2) (CMEMS product) and an evaluation of a gridded field of ocean surface pH based on CO2 system calculations. Link to public dataset: https://resources.marine.copernicus.eu/product-detail/GLOBAL_OMI_HEALTH_carbon_ph_area_averaged/DATA-ACCESS
Right graph:
Anomalies are calculated relative to a 1991-2020 average. For the satellite data (ESA CCI/C3S SST), the anomalies are calculated daily based on a daily climatology computed from a five-day mean centered on each day. For the in situ datasets, anomalies are calculated on a monthly basis by subtracting the 1991-2020 mean anomaly (relative to the original baseline used by the dataset) for each month. Daily anomalies were aggregated to monthly anomalies, and the monthly anomalies were aggregated to annual anomalies giving each month an equal weight.
Area-averaged anomalies were calculated using an area-weighted average of non-missing grid cells within the chosen region. A grid cell was assumed to be within a region if its center was within the region. Ocean area in the in situ products was estimated based on the high-resolution C3S satellite product, assigning 100% ocean area to grid cells populated in the satellite product and 100% land area to grid cells that are missing in that product. A 10-year rolling mean centered on right edge of the window is applied to the annual times series.
Due to lack of observations during some periods of 19th century and first half of 20th, Black Sea is only represented from the 1950s onward.
Uncertainty information in large scale aggregates is not available for the L4 satellite data, so uncertainties in this product were not computed. Uncertainties in the HadSST4 product were calculated following Kennedy et al. (2019). Correlated uncertainties were assumed to be correlated within a year and uncorrelated between years where appropriate. Uncertainties were not calculated for the ERSSTv5 and HadISST1 datasets. No uncertainty information is available for HadISST1. Pre-computed uncertainties in the ERSSTv5 data are available for the global mean but not for the European seas and other regional SST averages. Uncertainty in ERSSTv5 is represented by an ensemble, but the ensemble is not regularly updated. Final uncertainty (shown in figure) is based on maximum and minimum values of HadISST1, ERSSTv5 and higher and lower boundaries of HadSST4.
The areas used for the regional seas are the following:
• Europe: 35°–70°N, 25°W–40°E
• Baltic Sea: 52.5°–67.5°N, 8.5°–30.5°E
• Black Sea: 39.5°–48.5°N, 27.5°W–42.5°E
• Mediterranean: 30.5°–46.5°N, 6.5°W–38.5°E
• North Sea: 50.5°–60.5°N, 5.5°W–9.5°E
Additional information
Left graph:
See HOT_surface_CO2_readme.pdf for explanatory material, metadata, and notes https://hahana.soest.hawaii.edu/hot/hotco2/hotco2.html
https://data.marine.copernicus.eu/product/GLOBAL_OMI_HEALTH_carbon_ph_area_averaged/description
Temporal coverage:
Left graph: 1985-2021; Right graph: 1853-2022