All official European Union website addresses are in the europa.eu domain.
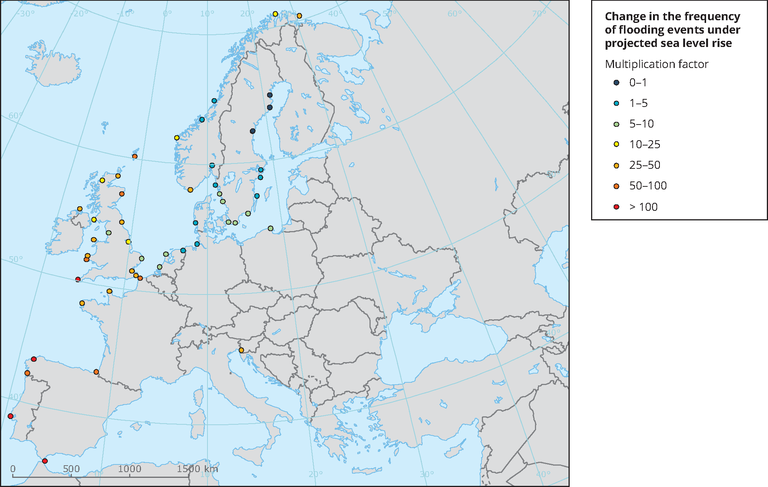
See all EU institutions and bodiesThis map shows the estimated multiplication factor, by which the frequency of flooding events of a given height changes between 2010 and 2100 due to projected regional sea relative level rise under the RCP4.5 scenario. Values larger than 1 indicate an increase in flooding frequency
Loading

