All official European Union website addresses are in the europa.eu domain.
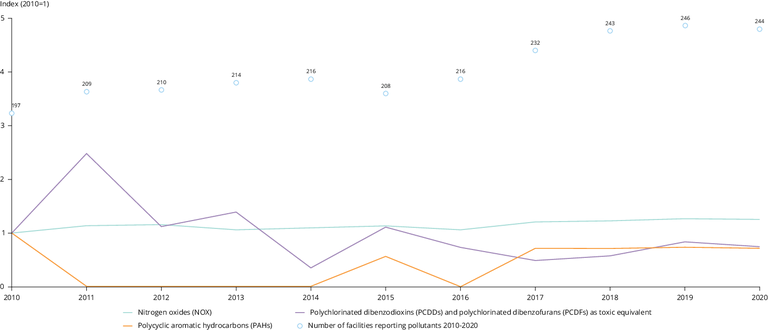
See all EU institutions and bodiesIncineration plants (non-hazardous waste incineration) — air emissions of selected pollutants, from 2010-2020, indexed to 2010
Chart (static)

An outlier removal and data cleaning exercise has been performed on the original officially-reported data. In addition to pollutant emissions, the graph also shows the trend in the number of facilities reporting emissions data in this sector. The indexed graph for dioxins and furans fluctuates sharply because of the small quantities reported by Member States, that is, these pollutants are emitted in such small quantities that small changes in absolute terms lead to sharp changes in the indexed graph. The following activity is covered: 5b in Annex I to the European Pollutant Release and Transfer Register (E-PRTR) Regulation (‘Installations for the incineration of non-hazardous waste in the scope of the IED; with a capacity of 3 tonnes per hour’). PAHs have been indexed to 2009 as a proxy because no PAH emissions were reported by this activity in 2010.
PCDD, polychlorinated dibenzodioxin; PCDF, polychlorinated dibenzofuran.
- Austria
- Belgium
- Bulgaria
- Croatia
- Cyprus
- Czechia
- Denmark
- Estonia
- Finland
- France
- Germany
- Greece
- Hungary
- Ireland
- Italy
- Latvia
- Lithuania
- Luxembourg
- Malta
- Netherlands
- Poland
- Portugal
- Romania
- Slovakia
- Slovenia
- Spain
- Sweden
Methodology
- Emissions data reported to the E-PRTR. Emissions indexed to 2010 (except PAH see above). There has been an outlier removal and data cleaning exercise on the original/official reported data, based on assessing the average emissions reported by other incineration plants and the incineration plant in question which had produced an outlier, and apply expert judgment on each data point.
- Original emissions are reported in kg per year but the graph presents them indexed to 2010 (PAH indexed to 2009).
