All official European Union website addresses are in the europa.eu domain.
See all EU institutions and bodies
An official website of the European Union | How do you know?
Environmental information systems
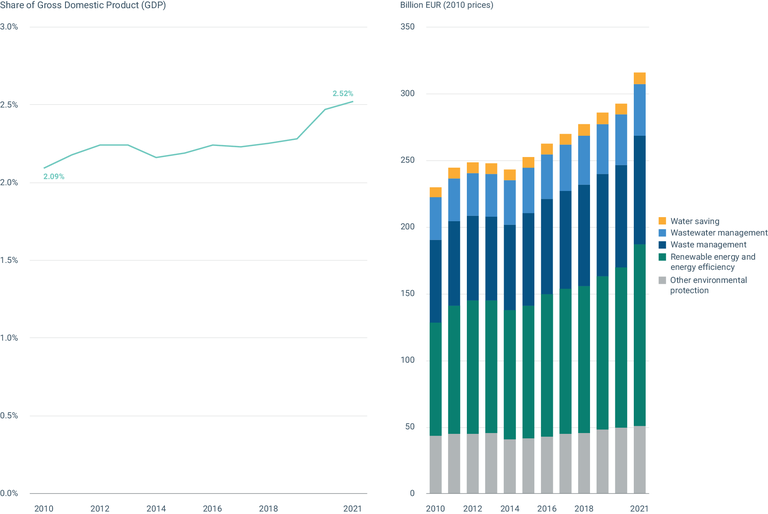
The figure shows the gross value added generated by the environmental goods and services sector, broken down by classification, along with the share of gross domestic product, at the EU-27 level from 2010-2021.
Loading