All official European Union website addresses are in the europa.eu domain.
See all EU institutions and bodies
An official website of the European Union | How do you know?
Environmental information systems
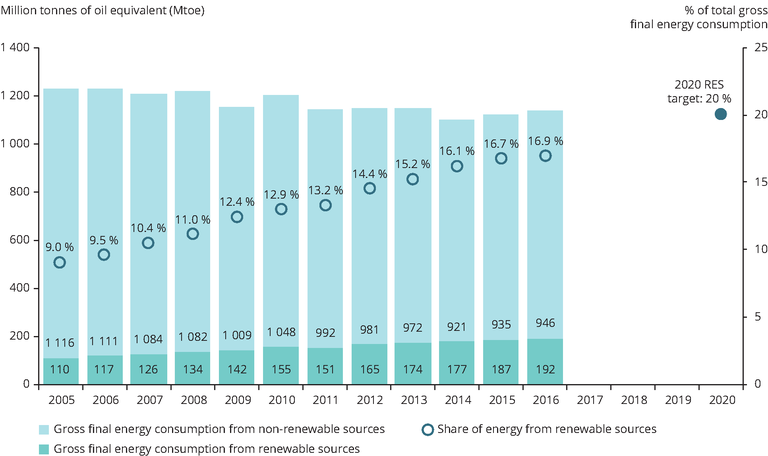
The bar charts represent the gross final renewable (green) and non-renewable (grey) energy consumption of the EU-28. The white dots show the renewable energy share of the EU-28 compared to the target in 2020.
Loading