All official European Union website addresses are in the europa.eu domain.
See all EU institutions and bodies
An official website of the European Union | How do you know?
Environmental information systems
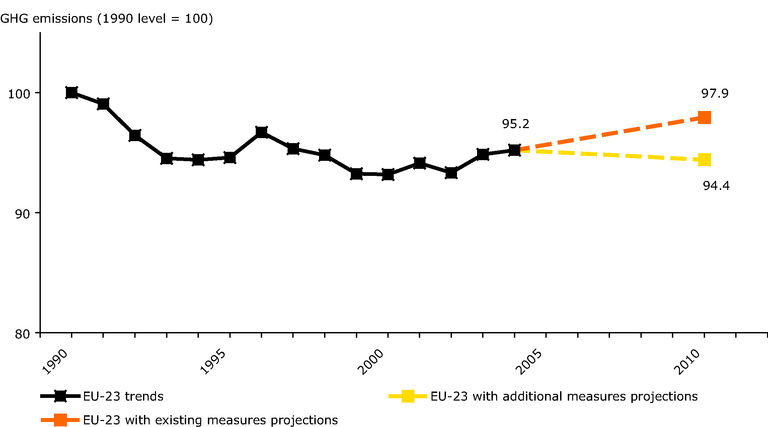
This graph shows the evolution of GHG emissions between 1990 and 2004 and the total projected emissions by 2010 in the EU-23 (see note about why EU-23 and not EU-25).
Loading