All official European Union website addresses are in the europa.eu domain.
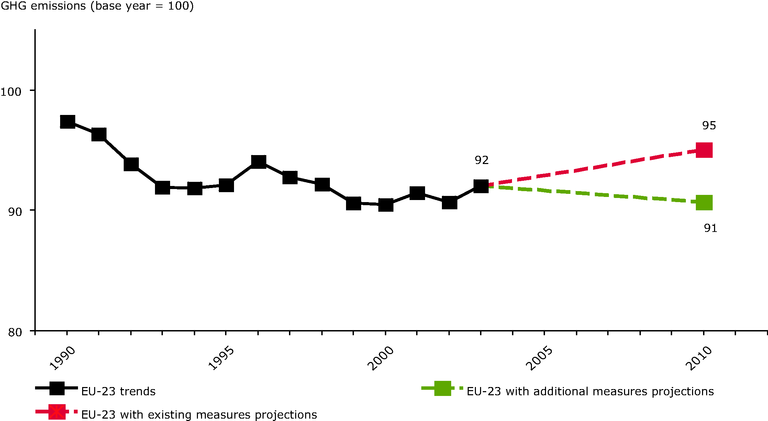
See all EU institutions and bodiesGreenhouse gas emission trends and projections for EU-23
Chart (static)
Data exclude emissions and removals from land use change and forestry

- Austria
- Belgium
- Czechia
- Denmark
- Estonia
- Finland
- France
- Germany
- Greece
- Hungary
- Ireland
- Italy
- Latvia
- Liechtenstein
- Lithuania
- Luxembourg
- Netherlands
- Poland
- Portugal
- Slovakia
- Slovenia
- Spain
- Sweden
- United Kingdom
The figure refers to a theoretical EU-23 baseyear as 100 in order to allow a consistent analysis of greenhouse gas emission trends and projections. This base-year for EU-23 has no legal status. 1990 is used for most Member States for CO2, methane (CH4) and nitrous oxide (N2O) but 1995 for fluorinated gases, with the following exceptions: The base year for CO2, CH4 and N2O for Hungary is the average of 1985-1987, for Slovenia 1986 and for Poland 1988; 1990 is the base year for fluorinated gases for France and Finland. This means that the value for 1990 is not exactly 100. Cyprus and Malta are not included due to lack of data and because they do not have targets under the Kyoto Protocol.
