All official European Union website addresses are in the europa.eu domain.
See all EU institutions and bodies
An official website of the European Union | How do you know?
Environmental information systems
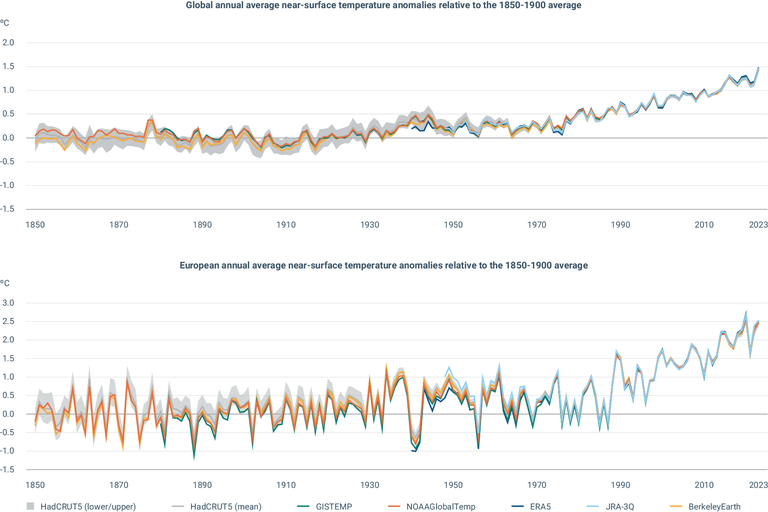
Above chart: Global annual averages of near-surface temperature of land and ocean expressed as the anomaly relative to the pre-industrial period 1850-1900 according to the datasets used by the Copernicus Climate Change Service (C3S): ERA5 (C3S/ECMWF), JRA-55 (JMA), GISTEMPv4 (NASA), HadCRUT5 (Met Office Hadley Centre), NOAAGlobalTempv6 (NOAA) and Berkeley Earth.
Below chart: European annual averages of near-surface temperature expressed as the anomaly relative to the pre-industrial period 1850-1900 according to the datasets used by the Copernicus Climate Change Service (C3S): ERA5 (C3S/ECMWF), JRA-55 (JMA), GISTEMPv4 (NASA), HadCRUT5 (Met Office Hadley Centre), NOAAGlobalTempv6 (NOAA) and Berkeley Earth.
Loading