All official European Union website addresses are in the europa.eu domain.
See all EU institutions and bodies
An official website of the European Union | How do you know?
Environmental information systems
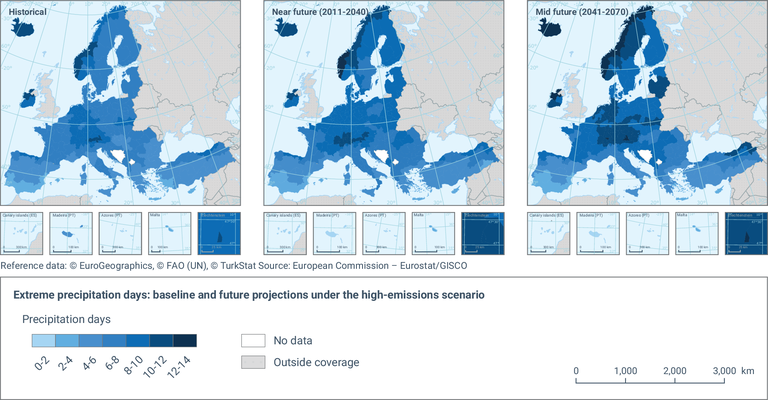
The maps shows the number of days in a year with daily total precipitation exceeding the 95th percentile threshold of rainy days of a reference period 1981-2010. Projections are made under the RCP 8.5 scenario. Interactive maps and additional information can be found in the European Climate Data Explorer.
Loading