All official European Union website addresses are in the europa.eu domain.
See all EU institutions and bodies
An official website of the European Union | How do you know?
Environmental information systems
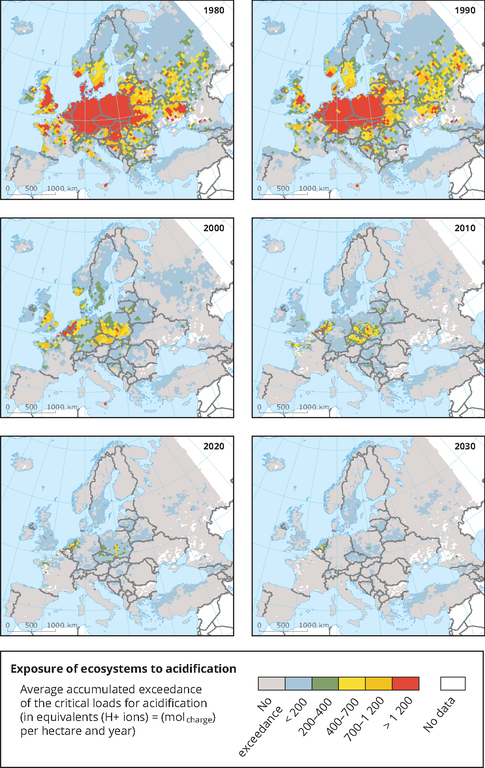
The maps show the average accumulated exceedance of critical loads for acidification in 1980 (top left), 1990 (top right), 2000 (middle left), 2010 (middle right), 2020 under the revised Gothenburg Protocol scenario emission reduction agreements (bottom left) and 2030 assuming maximum technically feasible reduction (bottom right).
Loading