All official European Union website addresses are in the europa.eu domain.
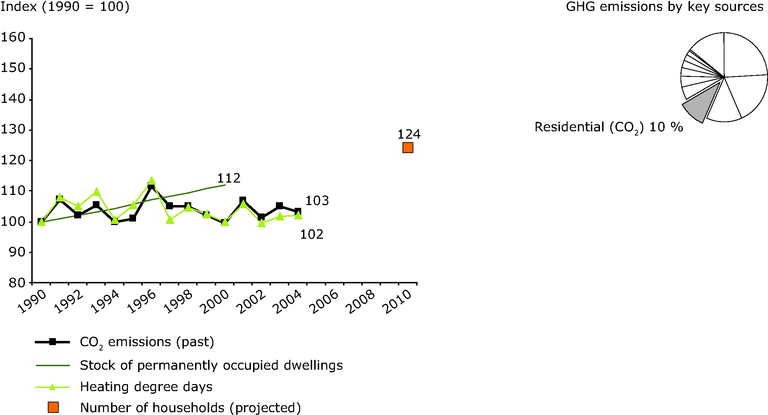
See all EU institutions and bodiesLeft: This graph shows past (1990-2004) and projected (2010) emissions due to energy use by households and compares them with the number of permanently occupied dwellings and heating degree days
Right: This graph represents the share of CO2 emissions from energy use by the residential sector in total GHG emissions in the EU-15, in 2004
Loading

