All official European Union website addresses are in the europa.eu domain.
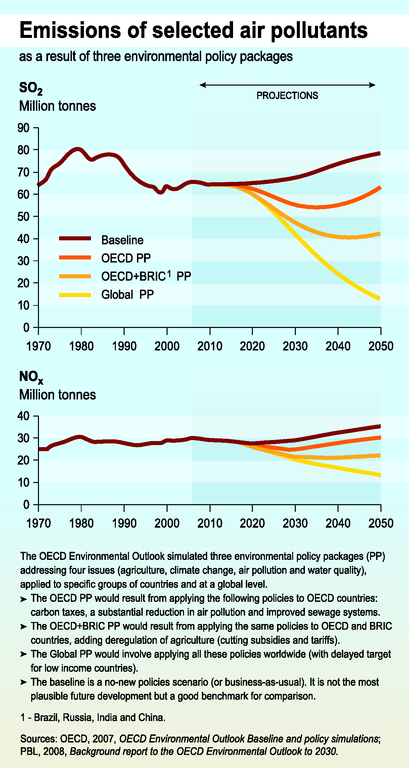
See all EU institutions and bodiesEmissions of selected air pollutants as a result of three environmental policy packages
Chart (static)
The 2 line graphics show SO2 and NOx emission trends from 1970 to 2050 according to 4 scenarios: the baseline, Global PP, OECD+BRIC PP, Global PP

- Albania
- Andorra
- Armenia
- Austria
- Azerbaijan
- Belarus
- Belgium
- Bosnia and Herzegovina
- Bulgaria
- Croatia
- Cyprus
- Czechia
- Denmark
- Estonia
- Finland
- France
- Georgia
- Germany
- Greece
- Hungary
- Iceland
- Ireland
- Italy
- Kazakhstan
- Latvia
- Liechtenstein
- Lithuania
- Luxembourg
- North Macedonia
- Malta
- Moldova
- Monaco
- Montenegro
- Netherlands
- Norway
- Poland
- Portugal
- Romania
- Russia
- San Marino
- Serbia
- Slovakia
- Slovenia
- Spain
- Sweden
- Switzerland
- Turkey
- Ukraine
- United Kingdom
Additional information
These graphs covers the world.
The OECD Environmental Outlook simulated three environmental policy packages (PP) addressing four issues (agriculture, climate change, air pollution and water quality), applied to specific groups of countries and at a global level.
- The OECD PP would result from applying the following policies to OECD countries: carbon taxes, a substantial reduction in air pollution and improved sewage systems.
- The OECD+BRIC PP would result from applying the same policies to OECD and BRIC countries (Brazil, Russia, India and China), adding deregulation of agriculture (cutting subsidies and tariffs).
- The Global PP would involve applying all these policies worldwide (with delayed target for low income countries).
- The baseline is a no-new policies scenario (or business-as-usual). It is not the most plausible future development but a good benchmark for comparison.
