All official European Union website addresses are in the europa.eu domain.
See all EU institutions and bodiesEmissions of pollutants from transport in EU-27
Chart (static)
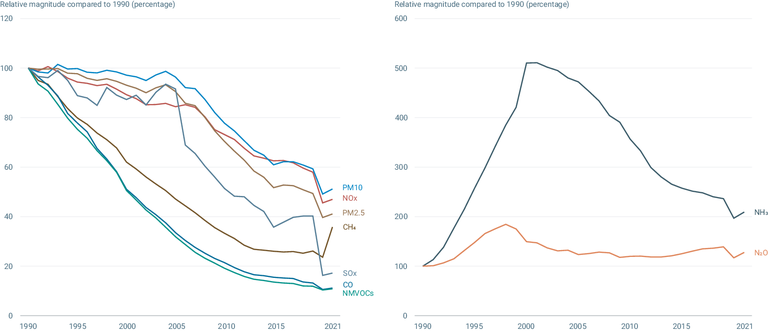
The figure shows the relative magnitude of emissions of pollutants from transport in EU-27 compared to 1990.

- Austria
- Belgium
- Bulgaria
- Croatia
- Cyprus
- Czechia
- Denmark
- Estonia
- Finland
- France
- Germany
- Greece
- Hungary
- Ireland
- Italy
- Latvia
- Lithuania
- Luxembourg
- Malta
- Poland
- Portugal
- Romania
- Slovakia
- Slovenia
- Spain
- Sweden
- The Netherlands
Methodology
For CO, NOx, NMVOCs, SOx, NH3, PM10 and PM2.5, data officially reported to the European Monitoring and Evaluation Programme (EMEP)/LRTAP Convention were used. For CH4 and N2O data officially reported under the United Nations Framework Convention on Climate Change (UNFCCC) and also under the Kyoto Protocol (KP) were used.
Where a complete time series of emission data has not been reported for CO, NOx, NMVOCs, SOx, NH3, PM10 and PM2.5, data have been gap filled according to the methodologies of the European Environment Agency's (EEA's) European Topic Centre on Air and Climate Change (ETC/ACC). Details of the gap-filling procedure for the air pollutant data set are described in the EU emission inventory report under the UNECE's Convention on LRTAP (EEA Technical Report No 5/2021). Similarly, for CH4 and N2O additional information on the gap-filling procedure can be found in the Annual European Union greenhouse gas inventory and inventory report Submission to the UNFCCC Secretariat.
