All official European Union website addresses are in the europa.eu domain.
See all EU institutions and bodies
An official website of the European Union | How do you know?
Environmental information systems
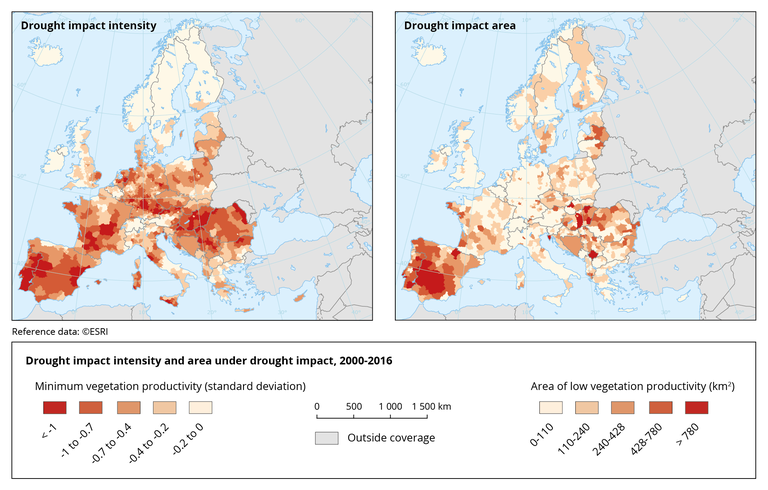
The map shows the long-term impact of water deficit on vegetation productivity, and the area of low vegetation productivity under water deficit impact, aggregated by NUTS3 regions. Negative anomalies are expressed in standard deviation and indicate vegetation productivity conditions that are lower than the long-term average under normal, non-drought conditions.
Loading