All official European Union website addresses are in the europa.eu domain.
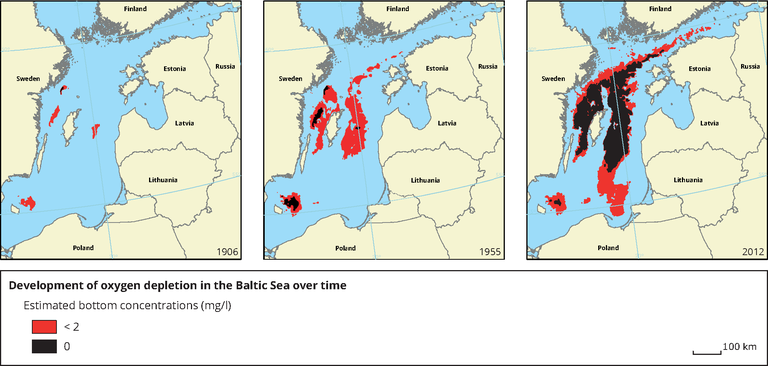
See all EU institutions and bodiesSpatial distribution of bottom hypoxia and anoxia in 1906 (left), 1955 (centre) and 2012 (right). Estimated bottom oxygen concentrations below 2 mg per litre are shown in red; black depicts the absence of oxygen. The spatial distribution represents means across all months.
Loading

