All official European Union website addresses are in the europa.eu domain.
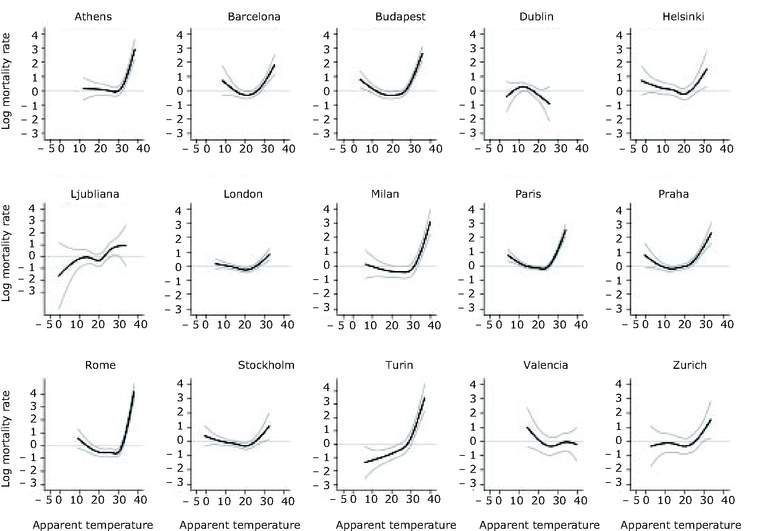
See all EU institutions and bodiesFigure shows relationship between daily maximum apparent temperature (Barcelona: mean apparent temperature) and natural mortality (blue) and 95% confidence interval (grey).
Loading

