All official European Union website addresses are in the europa.eu domain.
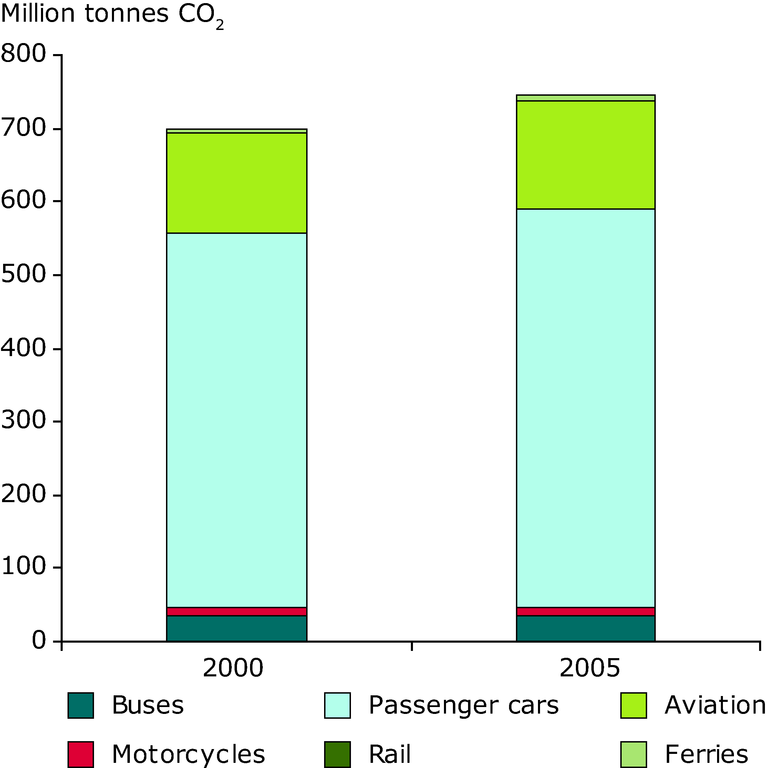
See all EU institutions and bodiesThe figure shows total CO2-emissions (attention: not CO2-equivalents; CH4 and N2O were left out due to data-constraints and insignificance as percentage of total emissions) for different means of transports’ usage-phase in the EU-27. Increasing travel resulted in increased direct emissions of CO2 from 2000 to 2005. Modes of transport with high CO2-intensity are private cars and aviation.
Loading

