All official European Union website addresses are in the europa.eu domain.
See all EU institutions and bodiesAn official website of the European Union | How do you know?
Environmental information systems
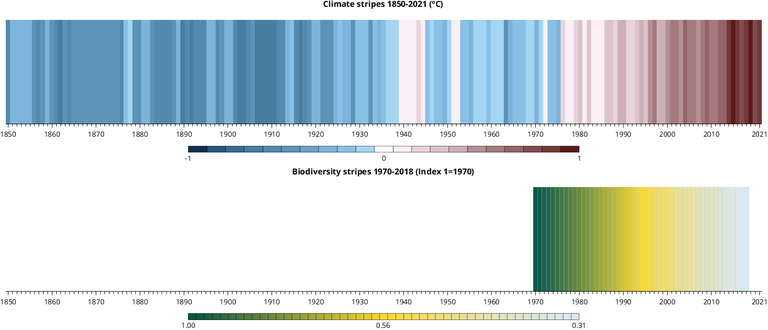
Climate stripes 1850-2021 (top figure) and biodiversity stripes 1970-2018 (bottom figure)
Chart (static)

(a) The global climate stripes use annual global average of near-surface temperatures expressed as the anomaly relative to the period 1961-1990 to show the progressive heating of the planet between 1850 and 2021. Shades of blue indicate cooler-than-average years, while red shows years that were hotter than average. (b) The global biodiversity stripes use the annual value of the global Living Planet Index to show the progressive loss of biodiversity between 1970 and 2018. Each stripe represents the value of the index for a given year. The chart shows a continued reduction in global biodiversity with a nearly 70 % decline of the index value in 2018 compared to 1970.
Downloads
Data sources
Metadata
More info
Loading
- Berkeley Earth
- ERA5 monthly averaged data on single levels from 1950 to 1978 (preliminary version)
- GISTEMPv4
- HadCRUT5
- Living Planet Index (latest results)
