All official European Union website addresses are in the europa.eu domain.
See all EU institutions and bodies
An official website of the European Union | How do you know?
Environmental information systems
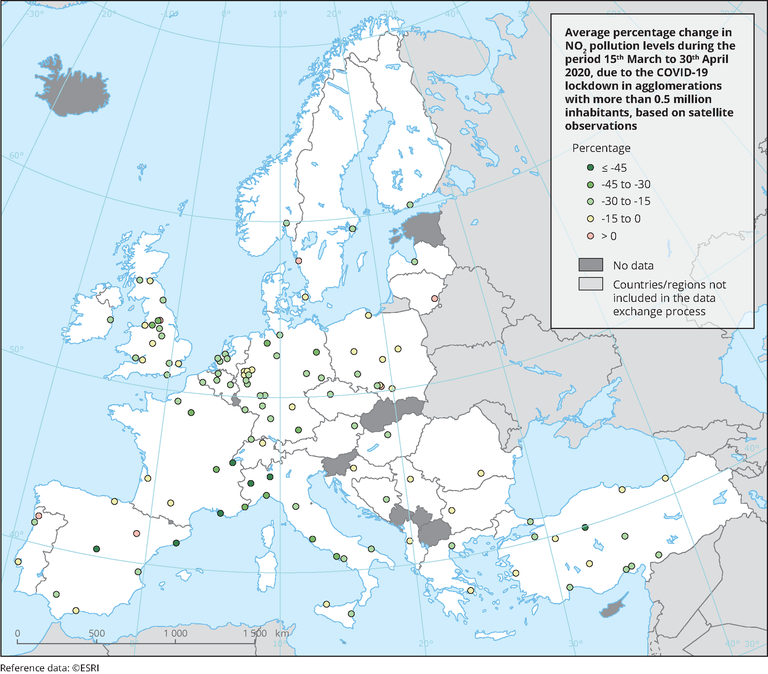
The map shows the average percentage change in NO2 pollution levels from NO2 TROPOMI satellite observations during the period 15th March to 30th April, comparing the observations under the COVID-19 lockdown to the business-as-usual scenario, in European agglomerations with more than half a million inhabitants. The gradient boosting regressor machine learning technique was used to simulate a business as usual (BAU) NO2 tropospheric columns satellite observations.
Loading