All official European Union website addresses are in the europa.eu domain.
See all EU institutions and bodies
An official website of the European Union | How do you know?
Environmental information systems
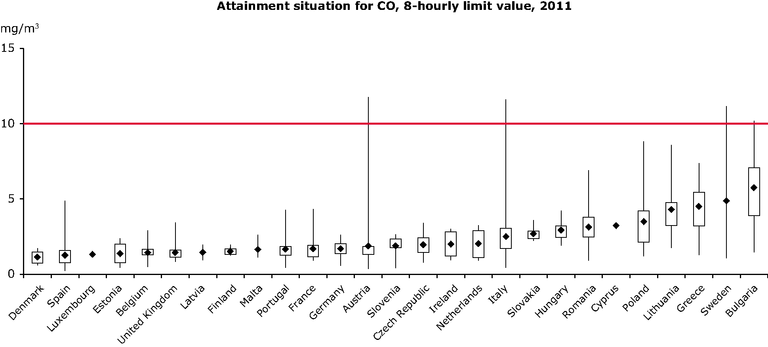
The graph is based on the maximum daily 8-hour mean value of CO concentrations (in mg/m3) for each Member State; the
boxes present the range of concentrations at all stations types officially reported by the EU Member States and how the
concentrations relate to the limit value set by EU legislation (marked by the red line).
The diagram indicates the lowest and highest observations, the means and the lower and upper quartiles. The lower quartile
splits the lowest 25 % of the data and the upper quartile splits the highest 25 % of the data.
Loading