All official European Union website addresses are in the europa.eu domain.
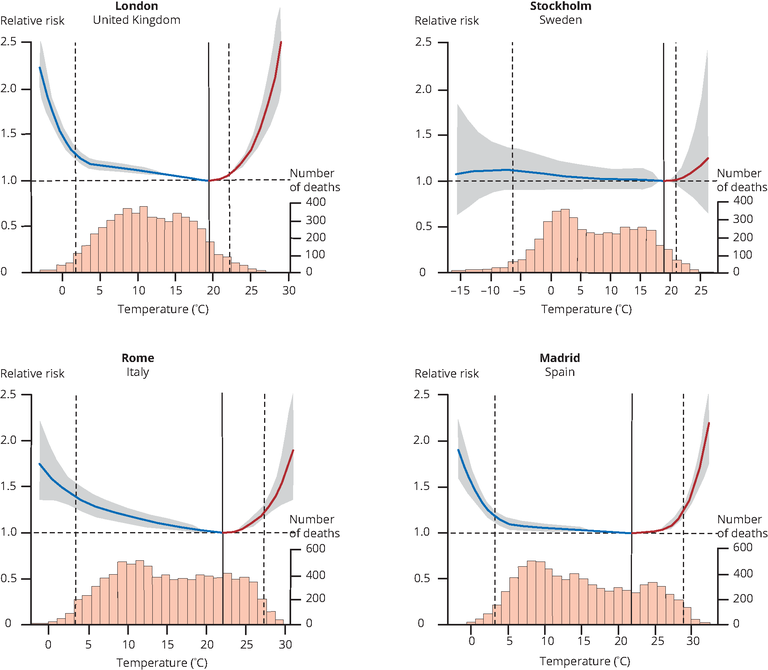
See all EU institutions and bodiesExposure-response associations between temperature and mortality in four European cities, together with related temperatures distributions.
The shaded grey area delineates the 95 % empirical confidence interval.
Solid grey vertical lines are minimum mortality temperatures and dashed grey vertical lines delineate the 2.5th and 97.5th percentile temperatures.
Loading

