All official European Union website addresses are in the europa.eu domain.
See all EU institutions and bodies
An official website of the European Union | How do you know?
Environmental information systems
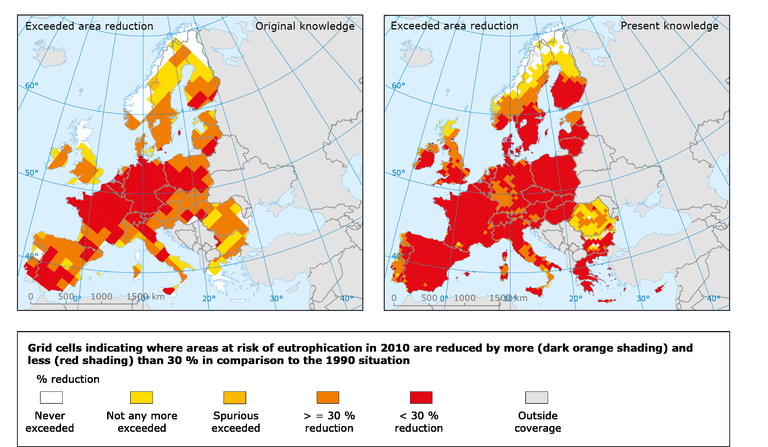
Grid cells indicating where areas at risk of eutrophication in 2010 are reduced by more
(dark orange shading) and less (red shading) than 30 % in comparison to the 1990
situation, when using original (left) and present (right) knowledge.
Loading