All official European Union website addresses are in the europa.eu domain.
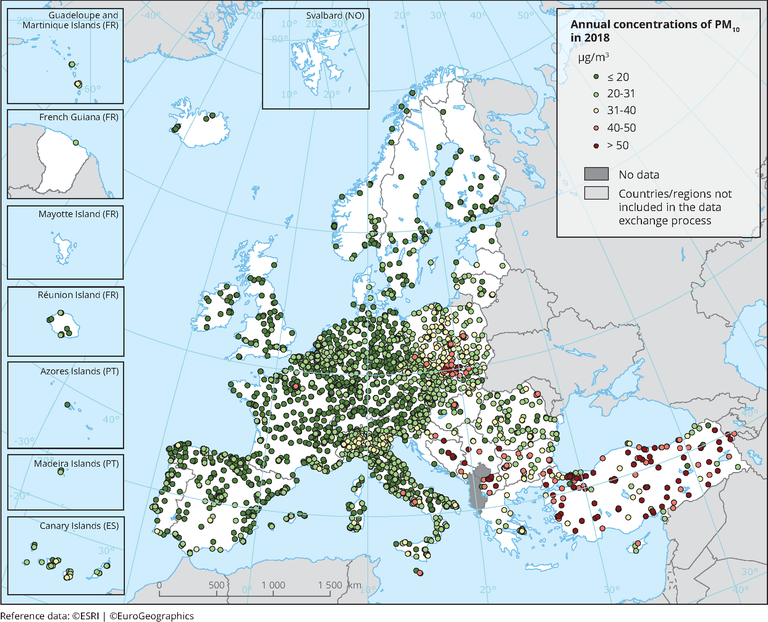
See all EU institutions and bodiesObserved concentrations of PM10 in 2018. The possibility of subtracting contributions to the measured concentrations from natural sources and winter road sanding/salting has not been considered. Dots in the last two colour categories indicate stations reporting concentrations above the EU annual limit value (40 μg/m3). Dots in the first colour category indicate stations reporting values below the WHO AQG for PM10 (20 μg/m3). Only stations with more than 75 % of valid data have been included in the map.
Loading

