All official European Union website addresses are in the europa.eu domain.
See all EU institutions and bodies
An official website of the European Union | How do you know?
Environmental information systems
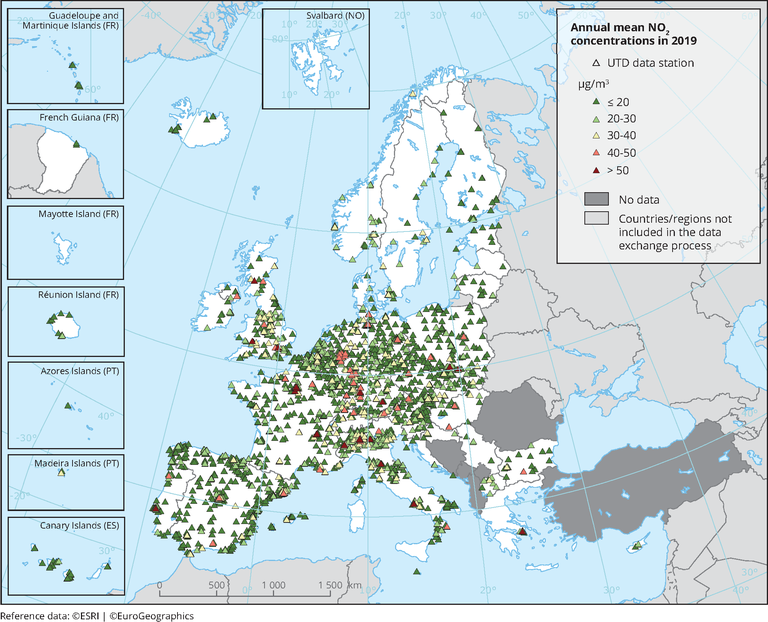
Observed concentrations of NO2 in 2019. The data presented were reported as up-to-date (UTD) data and therefore should be considered as not validated. They are used for the purpose of providing a preliminary assessment of the situation in 2019 in relation to the NO2 annual limit value. Triangles in the last two colour categories correspond to values above the EU annual limit value and the identical WHO AQG (40 μg/m3). Only stations with more than 75 % of valid UTD data have been included in the map.
Loading