All official European Union website addresses are in the europa.eu domain.
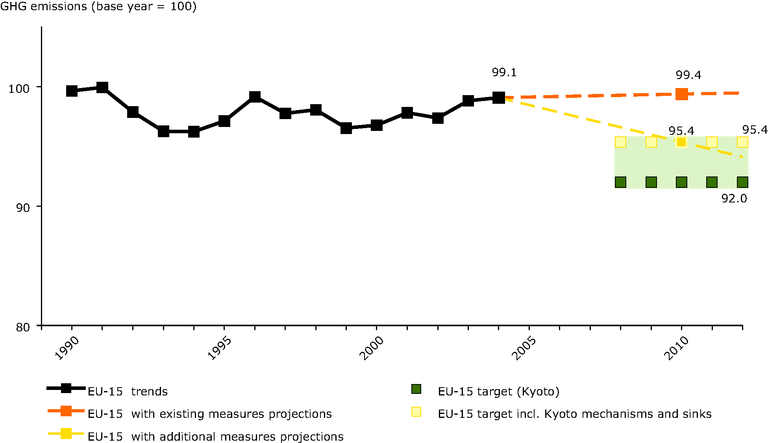
See all EU institutions and bodiesThis graph shows the evolution of GHG emissions between 1990 and 2004 and the total projected emissions by 2010 in the EU-15 Member States.
Loading

