All official European Union website addresses are in the europa.eu domain.
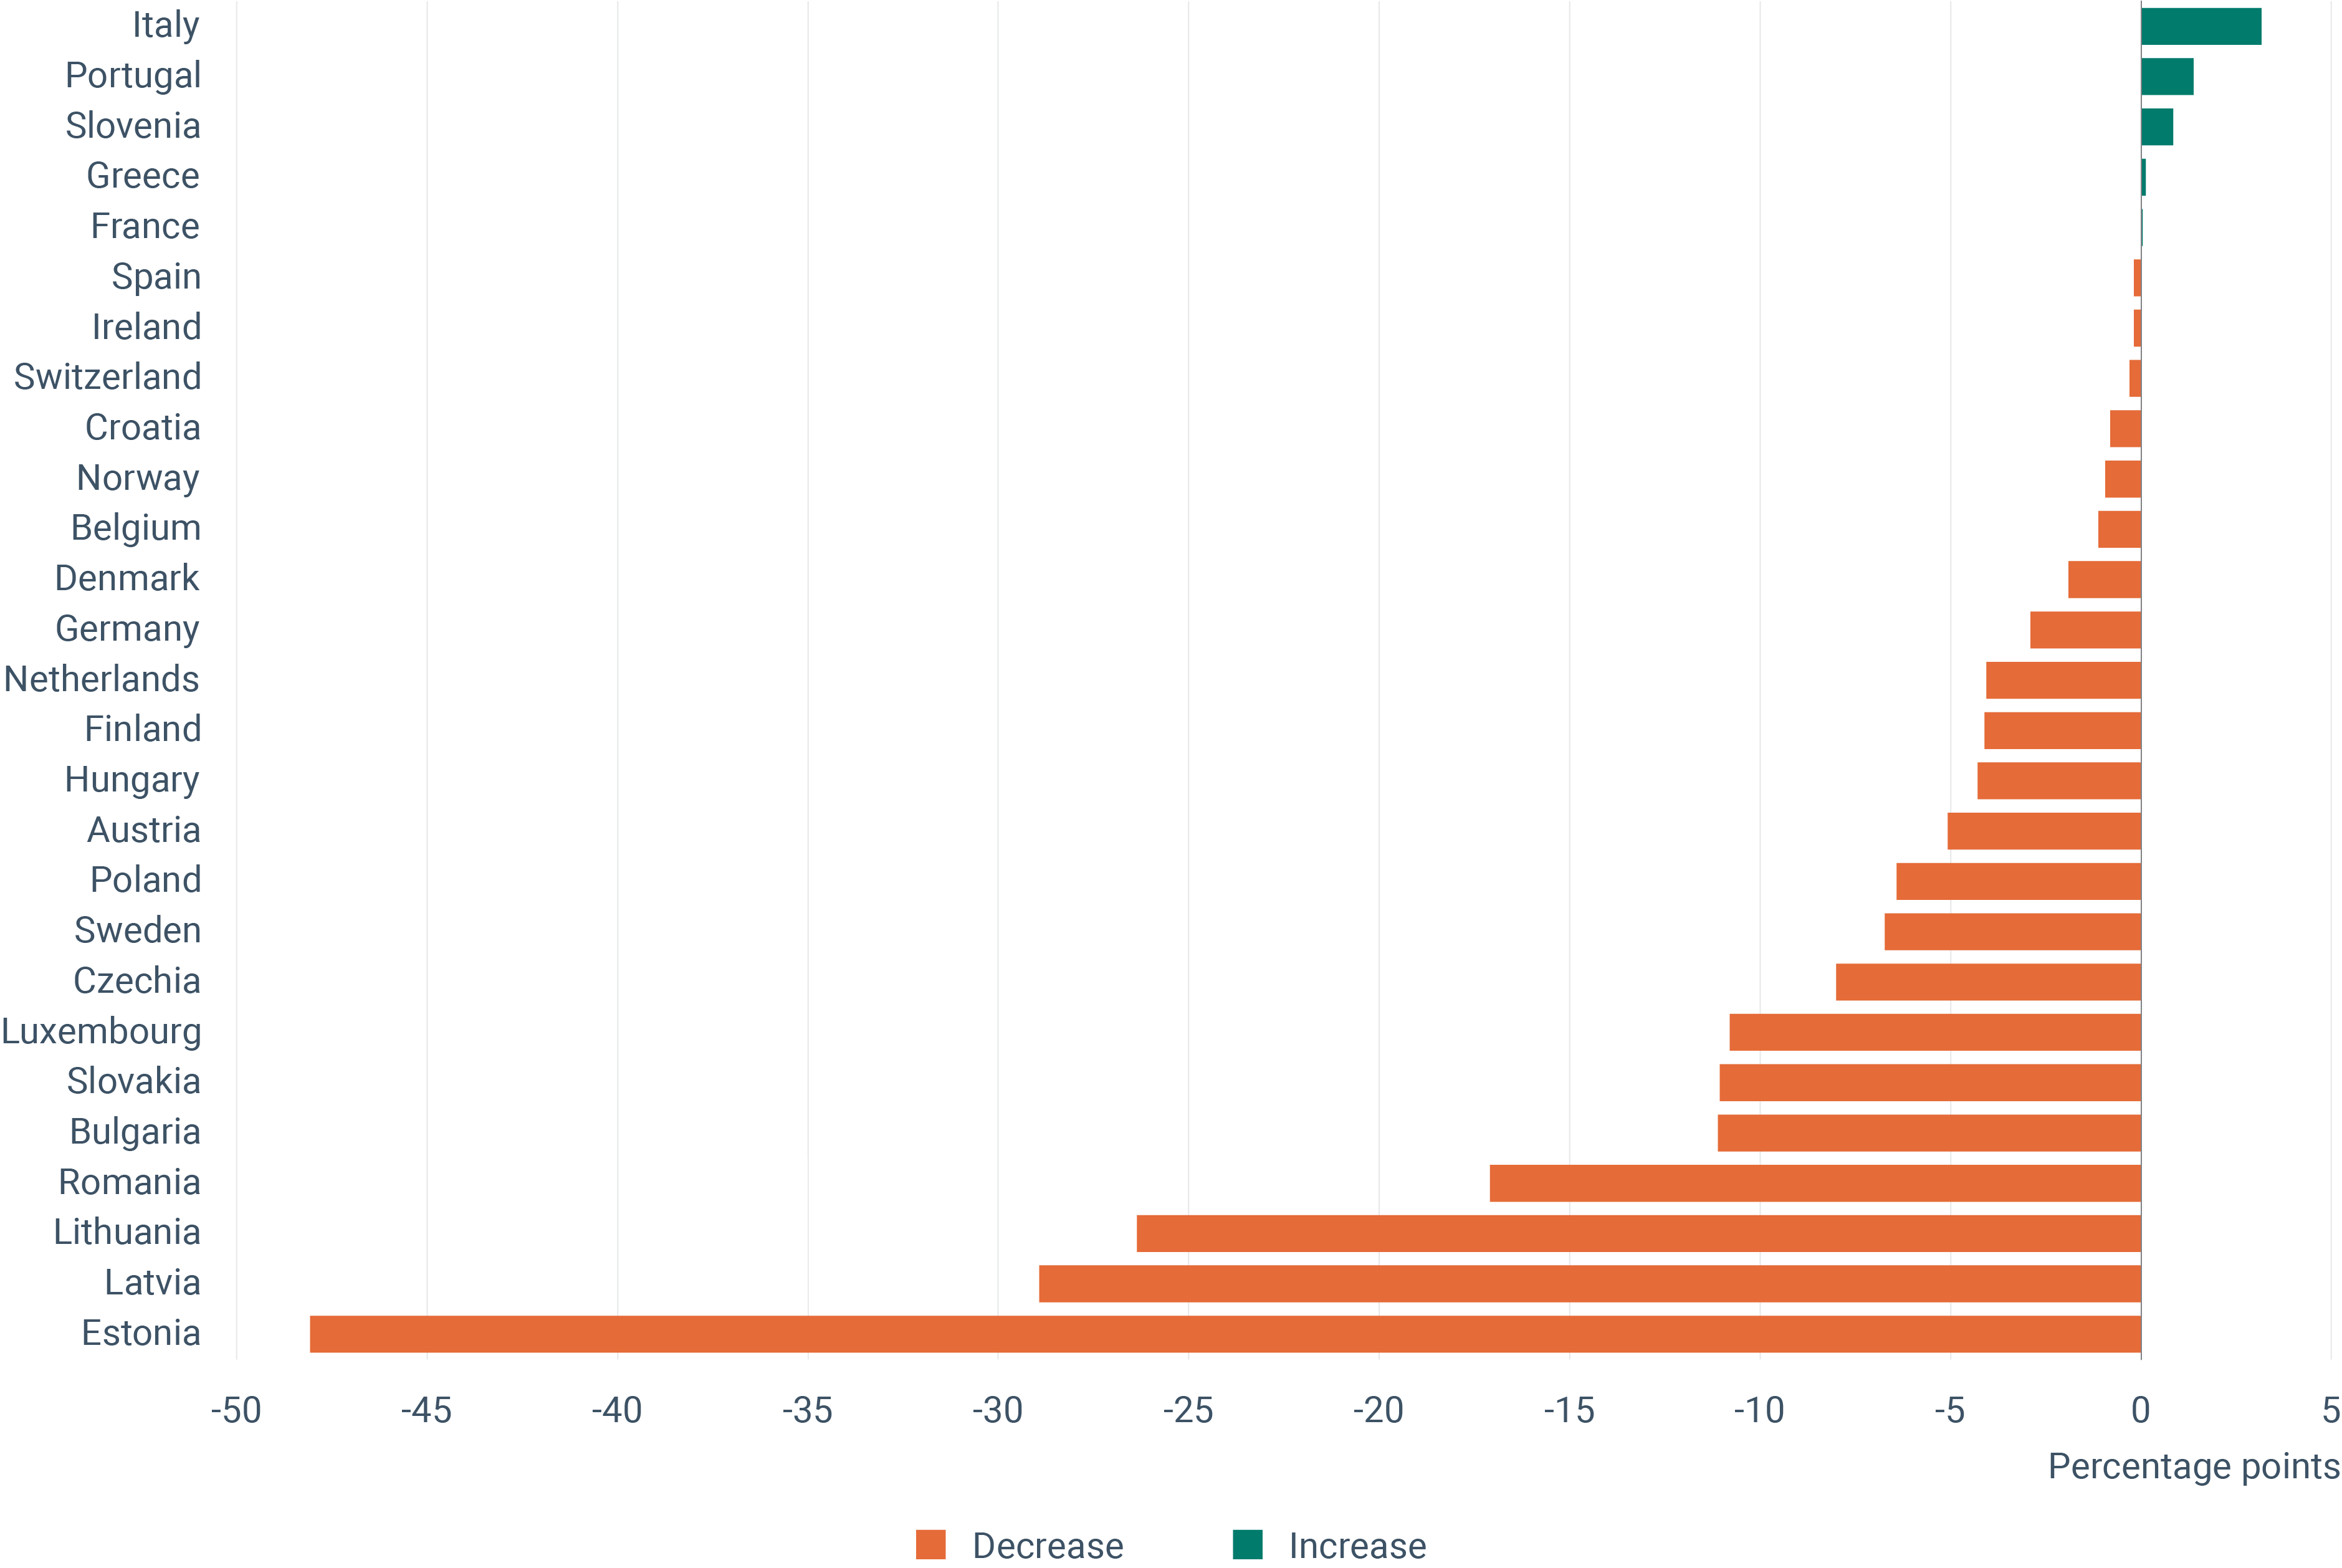
See all EU institutions and bodiesChanges in the share of inland waterways and trains in freight transport across European countries between 2010 and 2022
Chart (static)
The figure shows the percentage point variation in the share of inland waterways and trains in total inland freight transport activity by country.

- Statistical pocketbook 2024, European Commission, DG MOVE
- Portugal
- Spain
- Denmark
- Switzerland
- Sweden
- Netherlands
- Austria
- Belgium
- Germany
- Luxembourg
- Ireland
- France
- Slovakia
- Czechia
- Norway
- Italy
- Slovenia
- Greece
- Estonia
- Latvia
- Lithuania
- Finland
- Hungary
- Bulgaria
- Poland
- Romania
- Croatia
Additional information
The variation is in percentage points and it is calculated for the 2010-2022 period. Total inland freight transport performance includes transports by road, rail and inland waterways.
Methodology
Raw data by country of variation in the share of trains and inland waterways in total inland freight transport performance were retrieved from the 2024 version of the EU transport in figures statistical pocketbook published by DG MOVE. No additional gap filling was applied to the data. Data are displayed at country level and are expressed in percentage points. To provide the broadest possible picture of European countries, geographical coverage was extended to the 32 EEA member countries and the Western Balkan cooperating countries when data were available.
Additional information on the methodology used for data collection can be found here: Share of rail and inland waterways in inland freight transport (sdg_09_60) (europa.eu) and Share of buses and trains in inland passenger transport (sdg_09_50) (europa.eu)

