All official European Union website addresses are in the europa.eu domain.
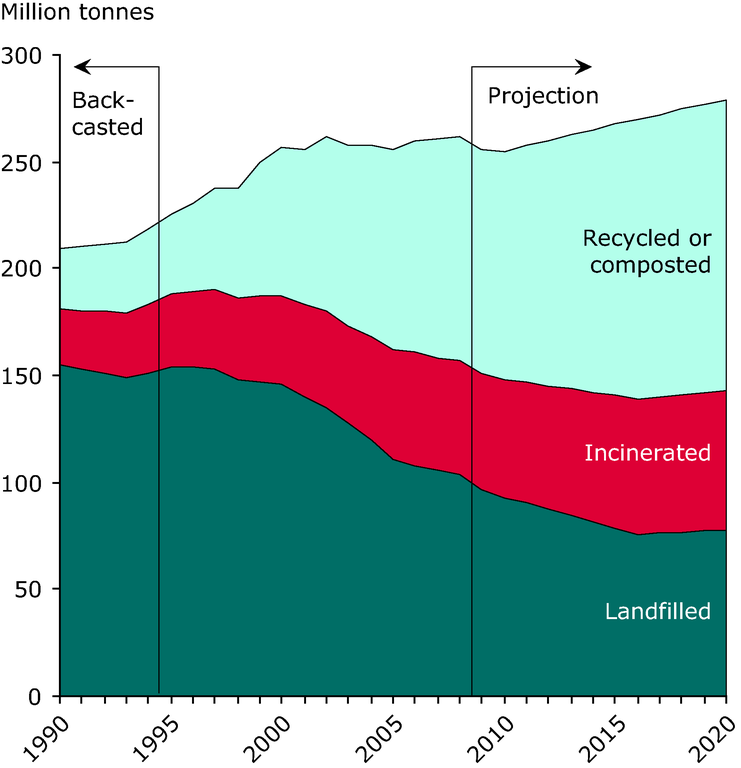
See all EU institutions and bodiesTrends and outlook for management of municipal waste in the EU-27 (excluding Cyprus) plus Norway and Switzerland, baseline scenario
Chart (static)
This figure shows the waste generation in the EU-27 (without Cyprus) plus Norway and Switzerland and the distribution between treatment paths from 1990 to 2020.

- Municipal waste by waste management operations (env_wasmun)
- Austria
- Belgium
- Bulgaria
- Czechia
- Denmark
- Estonia
- Finland
- France
- Germany
- Greece
- Hungary
- Ireland
- Italy
- Latvia
- Lithuania
- Luxembourg
- Malta
- Netherlands
- Norway
- Poland
- Portugal
- Romania
- Slovakia
- Slovenia
- Spain
- Sweden
- Switzerland
- United Kingdom
Methodology
The waste generation and distribution between treatment options for 1990-1994 has been backcasted by ETC/SCP’s best estimate. The data for 1995-2008 are based on reported data. The waste generation for 2009-2020 has been forecasted using historical trends, correlations between population, economic development and waste generation, and population and economic projections of the European Commission. The corresponding distribution between treatment options has been forecasted using ETC/SCP’s best estimate. This methodology is presented in the 2010 ETC/SCP paper "Projections of municipal solid waste management and greenhouse gas emissions" (forthcoming).
