All official European Union website addresses are in the europa.eu domain.
See all EU institutions and bodies
An official website of the European Union | How do you know?
Environmental information systems
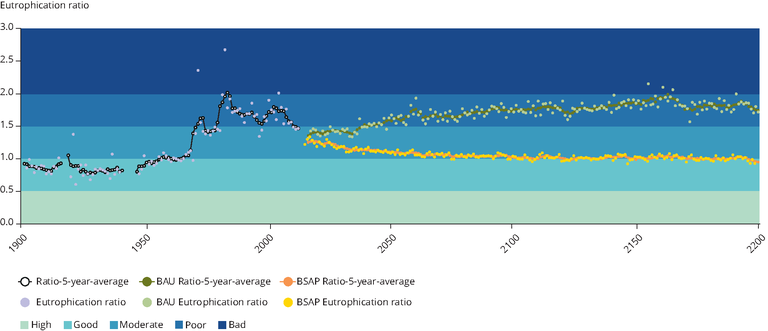
The chart shows the average Eutrophication Ratio for the entire Baltic for each year from 1900 to 2200, as well as a 5-year moving average. The eutrophication ratio is calculated by the HEAT tool. A value above 1 indicates that there is a Eutrophic status. A value below 1 indicate a good (non-eutrophic status).
Loading