All official European Union website addresses are in the europa.eu domain.
See all EU institutions and bodies
An official website of the European Union | How do you know?
Environmental information systems
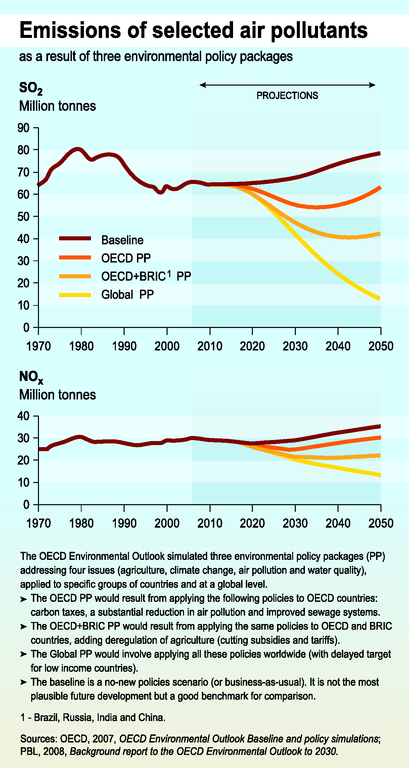
The 2 line graphics show SO2 and NOx emission trends from 1970 to 2050 according to 4 scenarios: the baseline, Global PP, OECD+BRIC PP, Global PP
Loading