All official European Union website addresses are in the europa.eu domain.
See all EU institutions and bodies
An official website of the European Union | How do you know?
Environmental information systems
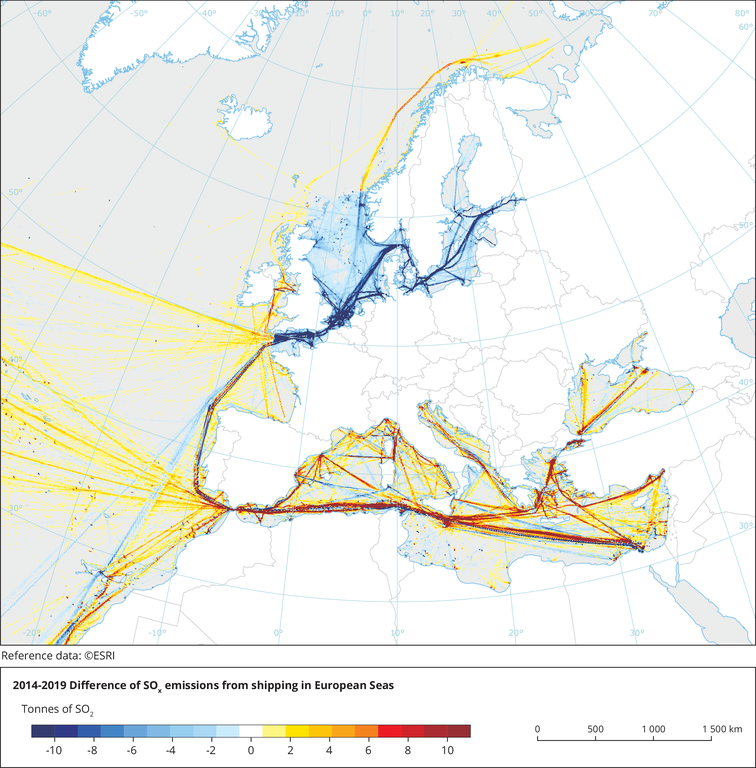
The map indicates the changes in ship SOx emissions, 2019 minus 2014 situation. The numerical values reported in the map are tonnes of SO2 per each grid cell of 0.05 by 0.1 deg (lat x lon)
Loading