All official European Union website addresses are in the europa.eu domain.
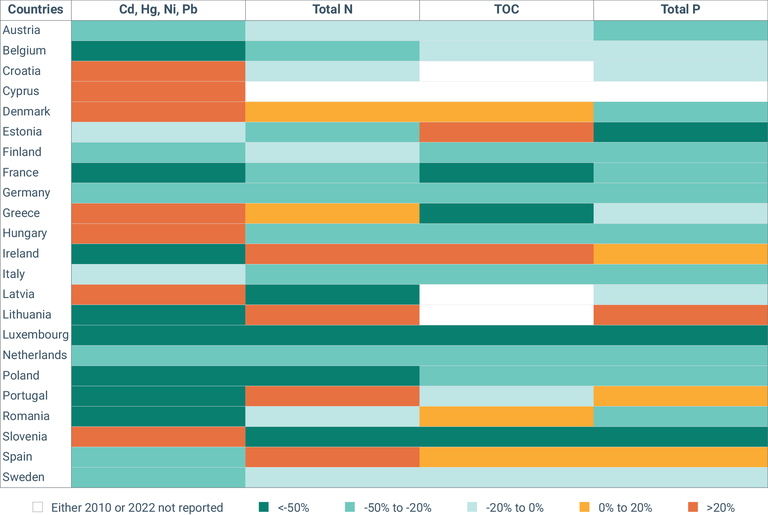
See all EU institutions and bodiesWater pollutant releases changes from 2010 to 2022 for the EU Member States
Chart (static)
The table show the top five emission reduction changes in pollutant releases into water in EU-27 Member States from 2010 to 2022.

- Industrial Reporting under the Industrial Emissions Directive 2010/75/EU and European Pollutant Release and Transfer Register Regulation (EC) No 166/2006 - ver. 10.0 Dec 2023 (Tabular data)
Methodology
Pollutant releases reported under E-PRTR/LCP dataflow for the relevant pollutant have been aggregated at EU-27 level and index against 2010 level has been calculated. Releases from Cd, Hg, Ni and Pb are aggregated together.
Additional information
TOC - total organic carbon, Total N - total nitrogen, Total P - total phosphorous, Cd - Cadmium, Hg - Mercury, Ni - Nickel, Pb - Lead. Croatia comparison is from 2014 because it was not an EU member state before.
Gap filling of non reported data is not performed to avoid production of anomalous % change between two given years.
For this reason Bulgaria, Czechia, Malta and Slovakia has been not considered.
