All official European Union website addresses are in the europa.eu domain.
See all EU institutions and bodies
An official website of the European Union | How do you know?
Environmental information systems
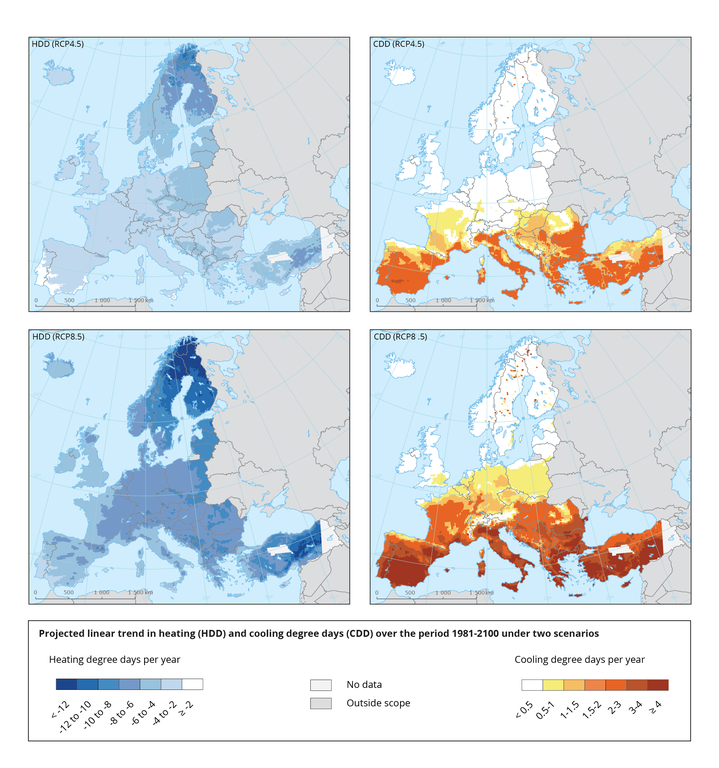
These maps show the trend in heating degree days (left) and cooling degree days (right) from 1981-2100 for all EEA member and cooperating countries, based on the median of an ensemble of 11 EURO-CORDEX simulations.
Loading