All official European Union website addresses are in the europa.eu domain.
See all EU institutions and bodies
An official website of the European Union | How do you know?
Environmental information systems
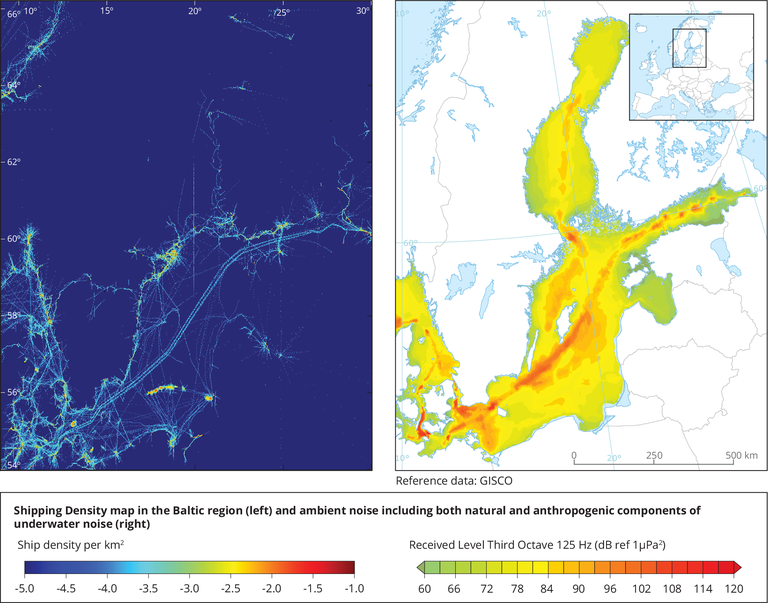
The left map shows the ship density of the Baltic Sea based on AIS and VMS data. The colour scale is presented in log10 for clarity. The data is for the whole year of 2014 and includes all categories of ships. The right map shows the median value of the sound pressure level for the 125 Hz 1/3-octave band. Elevated sound pressure levels are noted in the red areas where the shipping density is high. The sound pressure level was determined as an average over the entire water column.
Loading