All official European Union website addresses are in the europa.eu domain.
See all EU institutions and bodies
An official website of the European Union | How do you know?
Environmental information systems
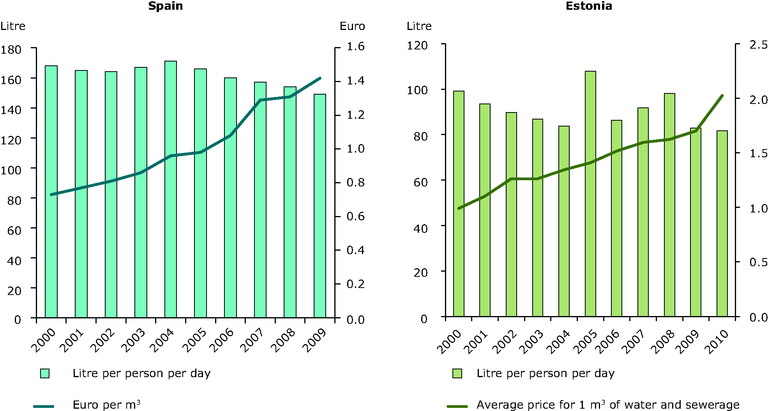
(left) The graph shows the development of average prices for drinking water supply and water consumption of households in Spain.
(right) The graph shows the development of average prices for water supply for human consumption in Estonia.
Loading