All official European Union website addresses are in the europa.eu domain.
See all EU institutions and bodiesWater exploitation index (WEI).
Chart (static)
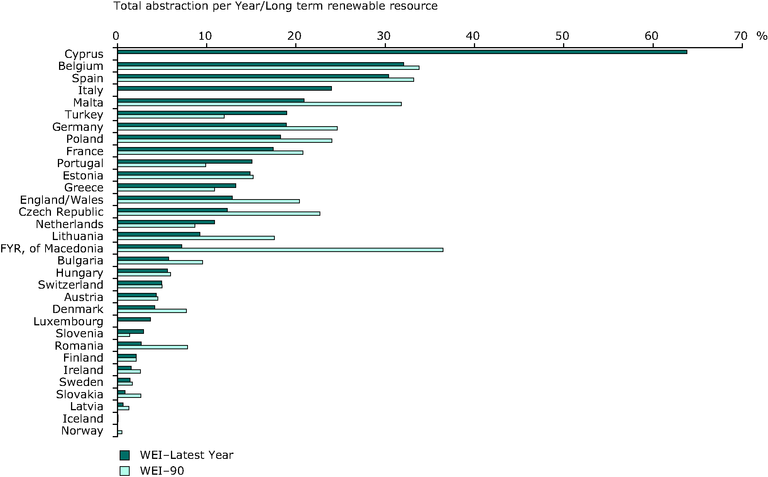
Annual total water abstraction as a percentage of available long-term freshwater resources around 1990 (WEI-90) compared to latest year available (1998–2007) (WEI-Latest Year).

- Austria
- Belgium
- Bulgaria
- Cyprus
- Czechia
- Denmark
- Estonia
- Finland
- France
- Germany
- Greece
- Hungary
- Iceland
- Ireland
- Italy
- Latvia
- Liechtenstein
- Lithuania
- Luxembourg
- Malta
- Netherlands
- Norway
- Poland
- Portugal
- Romania
- Slovakia
- Slovenia
- Spain
- Sweden
- Switzerland
- Turkey
- United Kingdom
External links, non EEA websites
http://epp.eurostat.ec.europa.eu/tgm/table.do?tab=table&init=1&plugin=1&language=en&pcode=ten00001
http://epp.eurostat.ec.europa.eu/tgm/table.do?tab=table&init=1&plugin=1&language=en&pcode=ten00002
Additional information
(WEI Latest year, WEI-90) = Cyprus (2007); Belgium (2005, 1994); Spain (2006, 1991); Italy (1998); Malta (2007, 1990); Turkey (2001, 1990); Germany (2004, 1991); Poland (2005, 1990); France (2006, 1991); Portugal (1998, 1990); Estonia (2007, 1990); Greece (2007, 1990); UK* (England/Wales) (2006, 1990); Czech Republic (2007, 1990); Netherlands (2006, 1990); Lithuania (2007, 1990); FYR, of Macedonia (1990, 2007); Bulgaria (2007, 1990); Hungary (2002, 1992); Switzerland (2006, 1990); Austria (1999, 1990); Denmark (2004, 1990); Luxembourg (1999); Slovenia (2007, 1990); Romania (2007, 1990); Finland (1999, 1990); Ireland (2007, 1994); Sweden (2007, 1990); Slovakia (2007, 1990), Latvia (2007, 1991); Iceland (2005, 1992); Norway (1985)
