All official European Union website addresses are in the europa.eu domain.
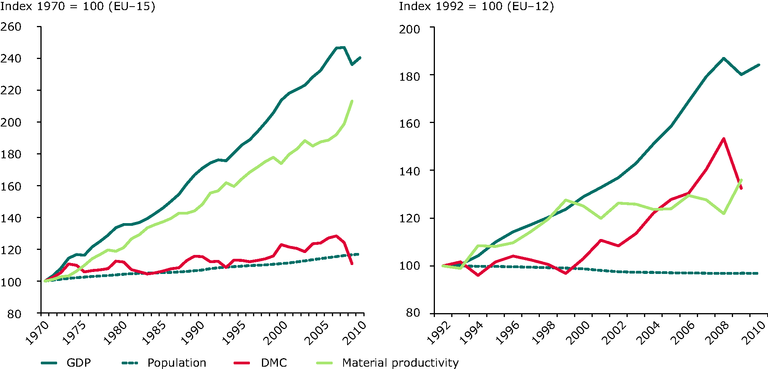
See all EU institutions and bodiesThis figure shows the changes of GDP, Population, DMC and Material Productivity for EU15 and EU12 between 1970 and 2011/2009 respectively 1992 and 2011/2009
Loading

