All official European Union website addresses are in the europa.eu domain.
See all EU institutions and bodiesAn official website of the European Union | How do you know?
Environmental information systems
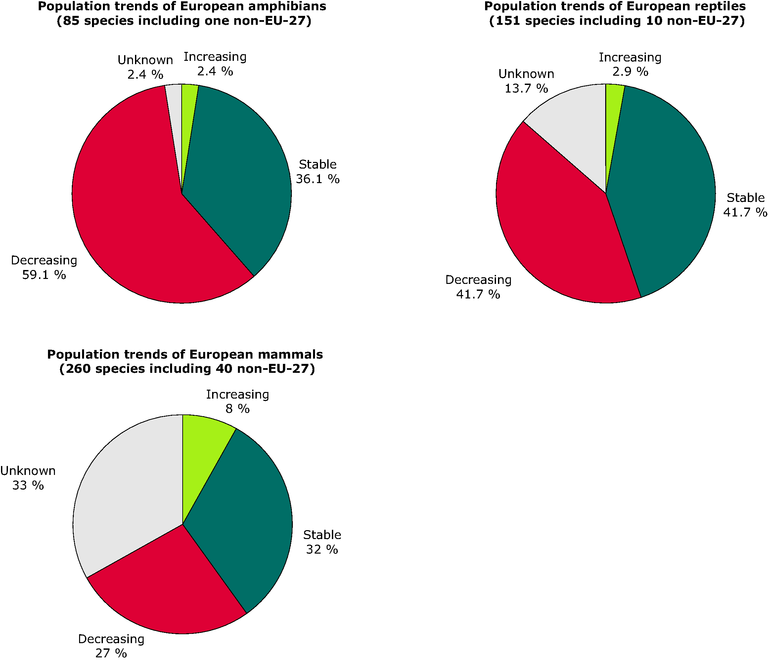
Trends of European amphibians, reptiles and mammals
Chart (static)
Population trends of European amphibians, reptiles and mammals.

Downloads
Data sources
Metadata
More info
Loading
- European Red List of Amphibians, IUCN 2009
- The Status and Distribution of European Mammals, IUCN 2007
- European Red List of Reptiles, IUCN 2009
- Greece
- Poland
- Romania
- Portugal
- Spain
- United Kingdom
- Netherlands
- Belgium
- Germany
- France
- Czechia
- Italy
- Cyprus
- Estonia
- Latvia
- Lithuania
- Finland
- Hungary
- Bulgaria
- Malta
- Denmark
- Sweden
- Austria
- Luxembourg
- Ireland
- Slovakia
- Slovenia
2007
2009
- Fifty-nine per cent of amphibians have declining populations: 36 % are stable and only 2 % are increasing.
- Some 42 % of reptile species are declining and only 3 % are increasing.
- Twenty-seven per cent of European mammals have declining populations: 32 % are stable; 33 % are of unknown population trend; and only 8 % of species populations are increasing.
