All official European Union website addresses are in the europa.eu domain.
See all EU institutions and bodiesAn official website of the European Union | How do you know?
Environmental information systems
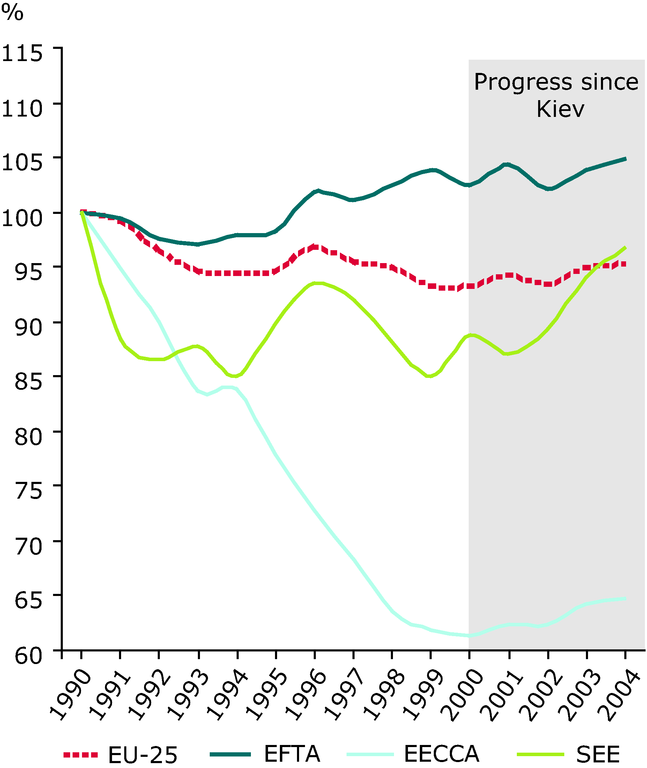
Trends in total greenhouse gas emissions
Chart (static)
Total greenhouse gas emissions are based on sectoral reported data by gas, mostly to the UNFCCC

Downloads
Data sources
Metadata
More info
Loading
- Albania
- Armenia
- Austria
- Azerbaijan
- Belarus
- Belgium
- Bosnia and Herzegovina
- Bulgaria
- Croatia
- Cyprus
- Czechia
- Denmark
- Estonia
- Finland
- France
- Georgia
- Germany
- Greece
- Hungary
- Iceland
- Ireland
- Italy
- Kazakhstan
- Kyrgyzstan
- Latvia
- Liechtenstein
- Lithuania
- Luxembourg
- Malta
- Moldova
- Montenegro
- Netherlands
- Norway
- Poland
- Portugal
- Romania
- Russia
- Serbia
- Slovakia
- Slovenia
- Spain
- Sweden
- Switzerland
- Tajikistan
- Turkey
- Turkmenistan
- Ukraine
- United Kingdom
- Uzbekistan
For some countries the reporting of some gases, mainly the fluorinated gases (and if a few number of cases of N2O), was incomplete. Because of the relatively low weight of the F-gases in total greenhouse gas emissions, the trends presented in the chart above should reflect rather accurately the development of total greenhouse gas emissions in the four regions. Index 1990 = 100. The volume of emissions in million tonnes of CO2-equivalents in 1990 was: EU25 = 5 231; EECCA = 4 630; SEE = 620; EFTA = 106.
