All official European Union website addresses are in the europa.eu domain.
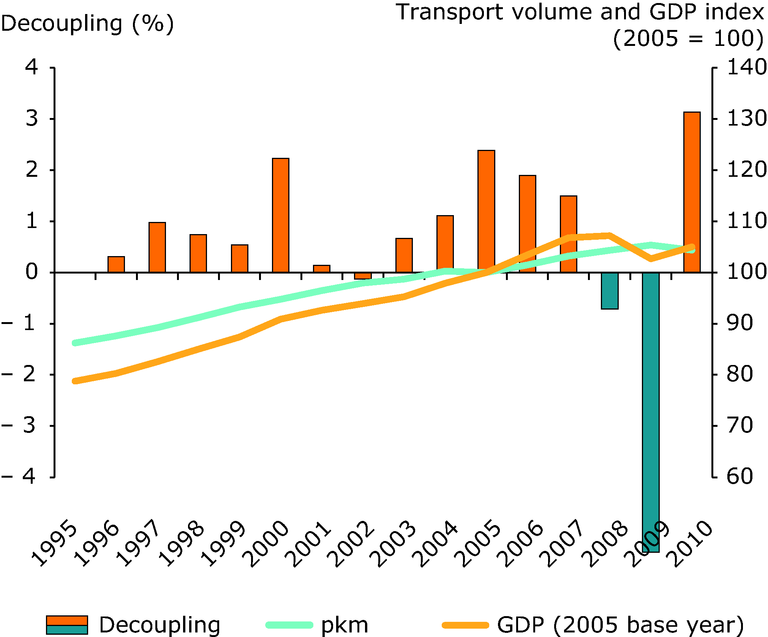
See all EU institutions and bodiesTrends in passenger transport demand and GDP (EEA-32 excluding Liechtenstein)
Chart (static)
Graph showing change in passenger transport volume and GDP versus time, together with the ‘decoupling’ relationship between them

- DG MOVE Data (Statistical pocketbook 2012)
- Greece
- Poland
- Romania
- Portugal
- Spain
- United Kingdom
- Netherlands
- Belgium
- Germany
- France
- Czechia
- Italy
- Cyprus
- Estonia
- Latvia
- Lithuania
- Finland
- Hungary
- Bulgaria
- Malta
- Denmark
- Iceland
- Switzerland
- Sweden
- Austria
- Luxembourg
- Ireland
- Liechtenstein
- Slovakia
- Norway
- Slovenia
Methodology
Dataset selection
EUROSTAT (Source 1) data has been used where it is available. Where Eurostat data is missing, the following procedure was used to determine how to fill the gap:
1. DG TREN (Source 2) data is used where available, unless:
2. Inserting the DG TREN data would lead to a large change that is unrealistic. In this case:
3. The trend of known values for EUROSTAT is compared to the trend of known values for DG TREN. If known values match closely, the DG TREN data is used.
4. If the known values do not match closely, it is assumed that there is a systematic difference between DG TREN and EUROSTAT data, and so DG TREN data is not used.
5. Instead, gapfilling procedures outlined below are used:
Gapfilling procedures
Where data is missing or different data sources have been used across the time series and this leads to large changes which are unrealistic, gap filling procedures have been employed to ensure a complete dataset and to improve the reliability of the trends found.
The approach used is in accordance with that used for greenhouse gas inventories under the EU MM
Where appropriate extrapolation of data has been used. This can be divided into 2 types:
1. Linear trend extrapolation - this is used where there is a smooth trend in the time series i.e. No large annual variations.
In general the linear trend extrapolation is based on the most recent 10-year-period; however, if only a limited number of years were available
or a more consistent time series was available for specific years then these years were used for the linear trend extrapolation.
2. Use of previous year’s values were used in case of large annual variations (dips and jumps)
because in this case the previous year value is considered to be as robust as any other value.
If emission estimates are not available for years within the time series, linear trend interpolation is used
Additional information
The two curves show the development in GDP and passenger transport volumes, while the columns show the level of annual decoupling. Green indicates greater growth in GDP than in transport while blue indicates stronger growth in transport than in GDP. The data refer to road, rail and bus modes of transport.
